Virginia Beach’s short-term rental (STR) market has experienced significant growth, driven by its appealing coastal attractions and favorable regulations. The city permits STRs primarily in two areas: the Sandbridge Special Service District, where properties can operate with an annual zoning permit, and the Oceanfront Resort Short-Term Rental Overlay District, which requires both a Conditional Use Permit (CUP) and an annual zoning permit. Properties outside these zones are generally restricted from STR operations unless they are “grandfathered,” meaning they were registered and compliant with tax obligations before July 1, 2018.
This regulatory framework has fostered a robust STR market, with total revenue consistently rising, particularly during peak-season months like July. This article delves into the dynamics of Virginia Beach’s STR market, analyzing revenue trends, property types, and the impact of amenities across different seasons. By understanding these factors, investors and property managers can make informed decisions to optimize returns in this thriving coastal market.
Performance Trends and Investor Returns
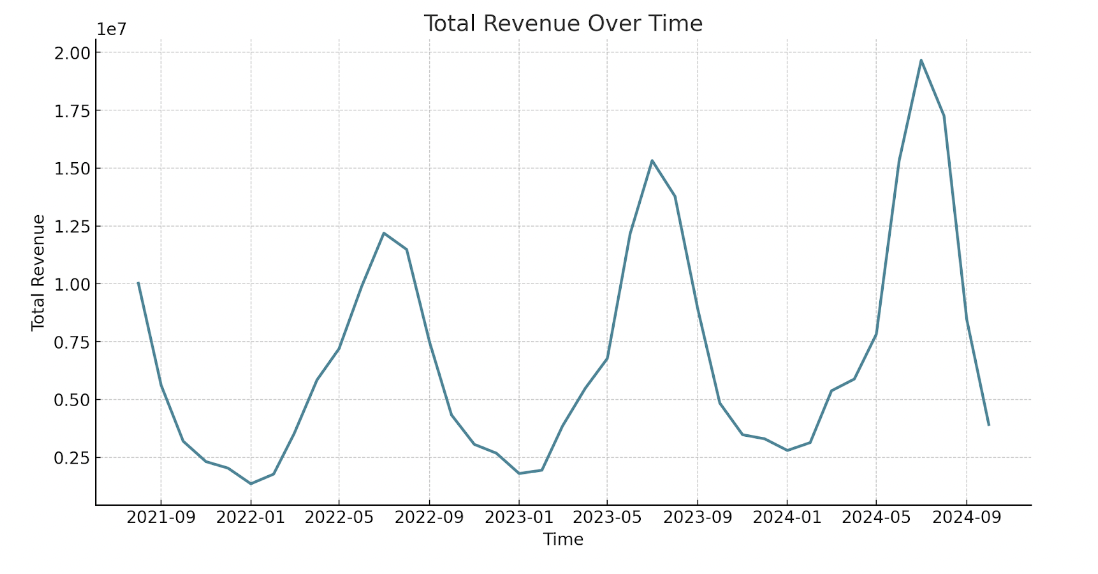
Total revenue has consistently risen, especially in peak-season months like July, with a 26% increase from 2022 to 2023, followed by a 28% jump from 2023 to 2024. This pattern suggests that the peak season is attracting more tourist demand year over year during summer months.
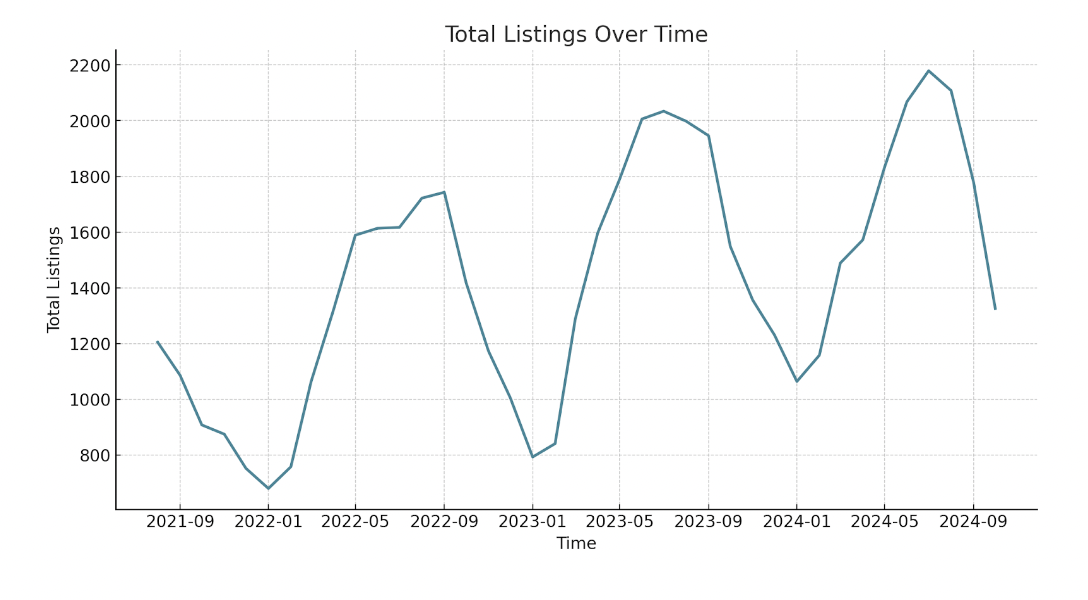
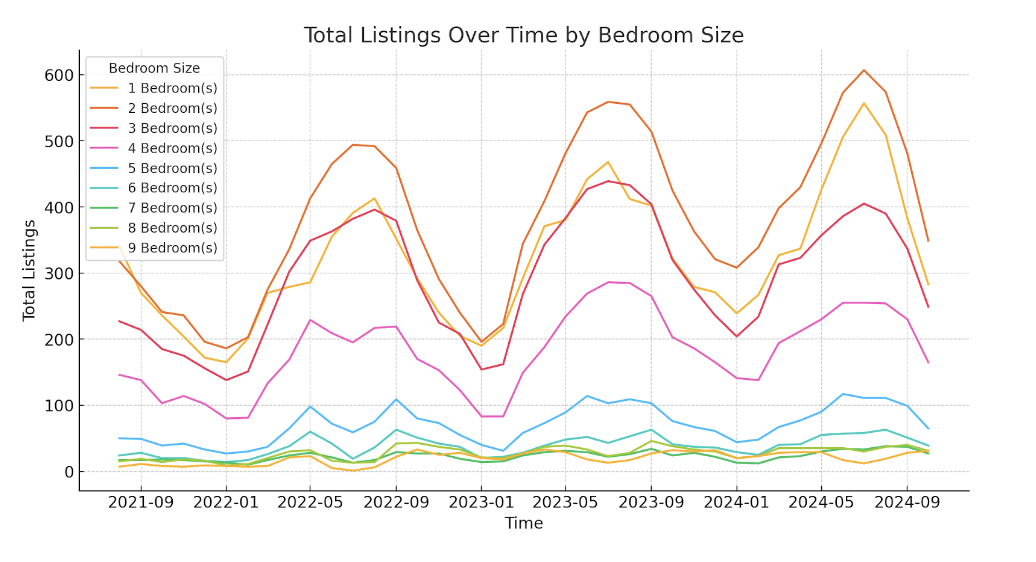
The number of short-term rental listings has also grown steadily. From July 2022 to 2023, listings rose by 26%, and then grew by an additional 7% from 2023 to 2024, signaling confidence among investors in the market’s profitability.
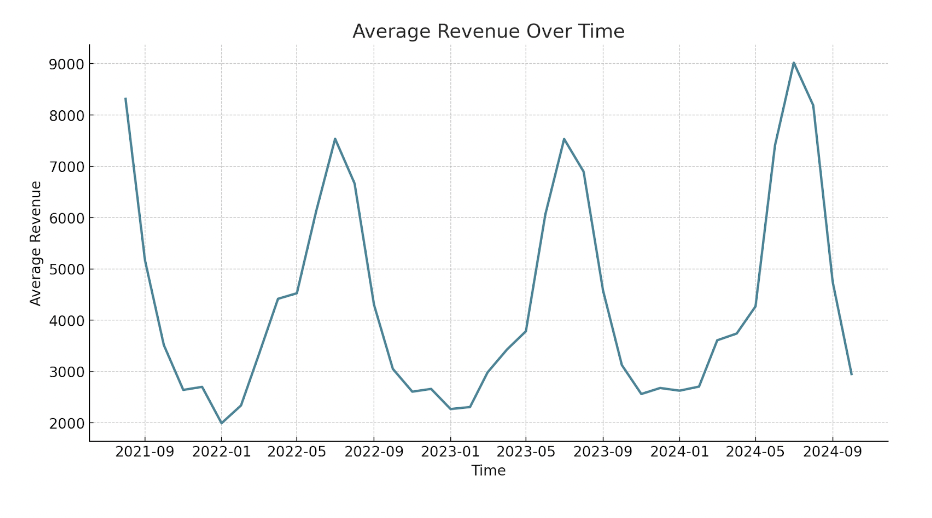
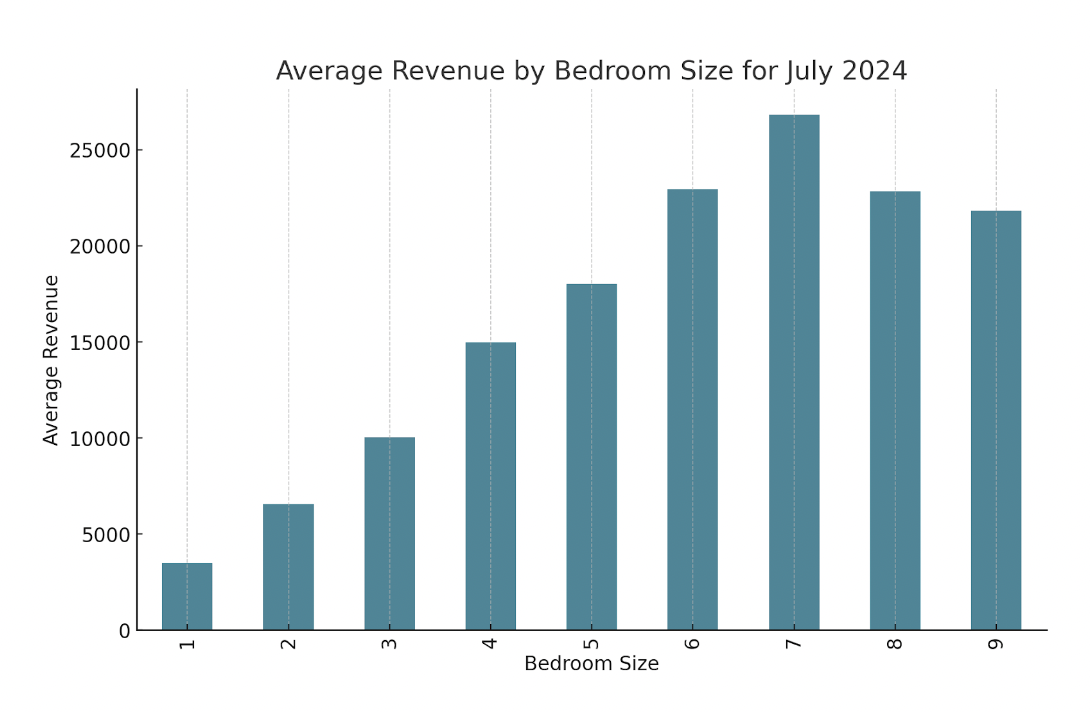
The impacts of this are reflected by average investor returns. Average revenue remained steady between July 2022 and 2023, and surged by 20% in 2024.
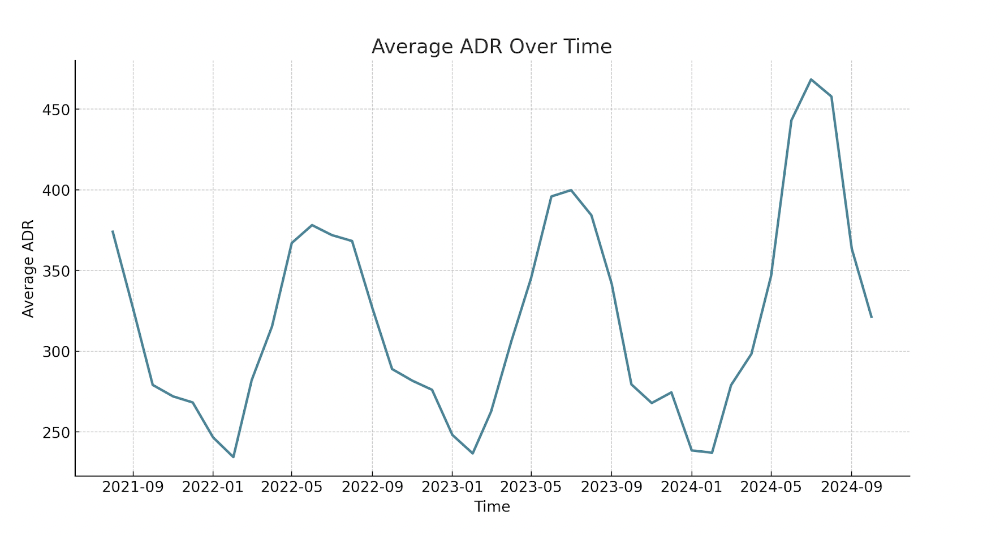
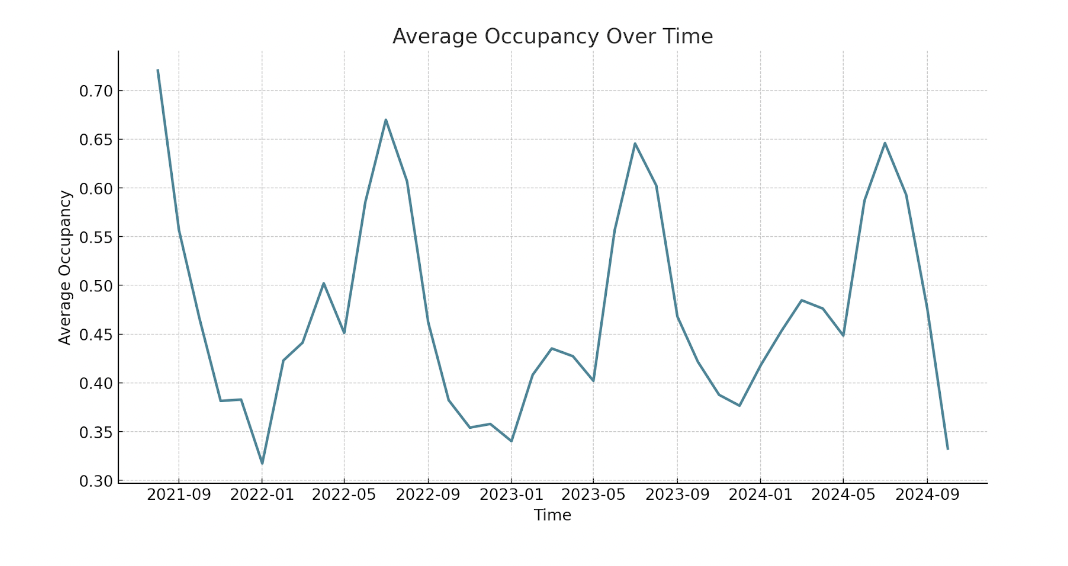
This has largely been driven by rising Average Daily Rate (ADR). ADR has consistently risen each July, with a 7% increase from 2022 to 2023, and another jump of 17% from 2023 to 2024. This rise in ADR has bolstered revenue, supporting income even as occupancy experiences a slight downward trend. Notably, occupancy rates fell by 4% from July 2022 to 2023, then stabilized with a 0.08% increase in 2024.
Market Composition and Property Type Analysis
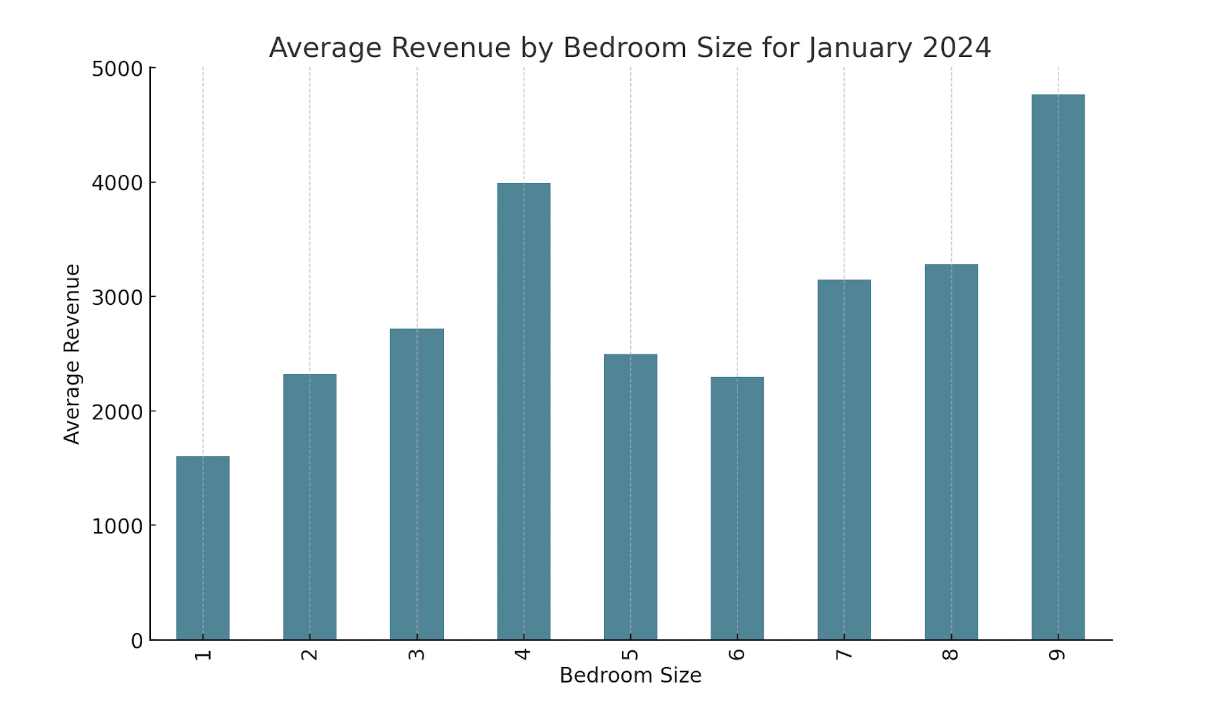
In July 2024, smaller properties, particularly 1- and 2-bedroom units, represented a significant portion of the market, with saturation of 27% and 29% respectively. In contrast, larger properties show a lesser market presence, with 3-, 4-, and 5-bedroom listings making up 20%, 12%, and 5% of the market.
About 33% of 1-bedroom listings and 43% of 2-bedroom listings in July were apartments. However, larger properties have a significantly lower apartment presence—only 16% of 4-bedroom listings and 3% of 5-bedroom listings were apartments, with none among properties with 6 or more bedrooms.
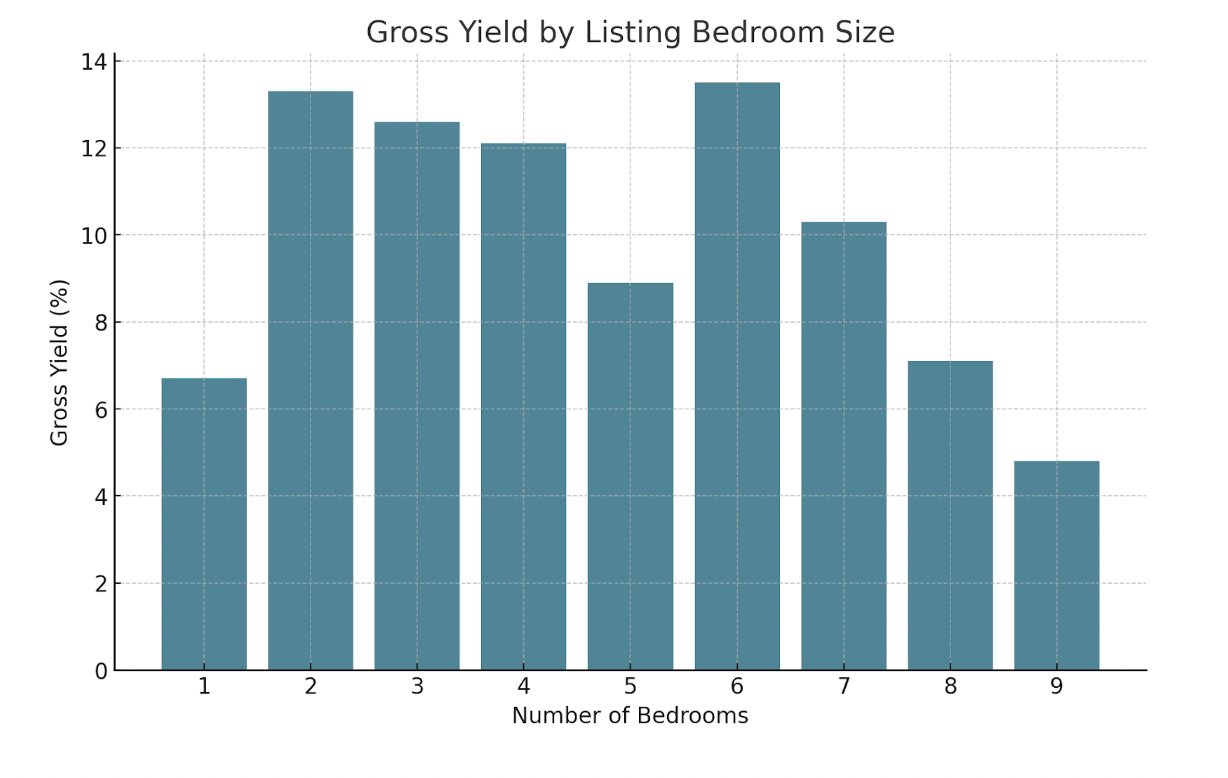
- 1 Bedroom: 6.70%
- 2 Bedrooms: 13.30%
- 3 Bedrooms: 12.60%
- 4 Bedrooms: 12.10%
- 5 Bedrooms: 8.90%
- 6 Bedrooms: 13.50%
- 7 Bedrooms: 10.30%
- 8 Bedrooms: 7.10%
- 9 Bedrooms: 4.80%
These values suggest that, relative to purchase costs, 2- and 6-bedroom properties offer the most favorable returns, helping investors recover their initial investment more efficiently than other property sizes.
Amenity Saturation and Revenue Impact
In July 2024, certain amenities had notably high market saturation. Pools, for instance, are by far the most common feature, present in 48% of all listings (1,050 listings). Waterfront properties make up 28% (609 listings) and hot tubs follow with 12% (263 listings). Golf amenities were available in 11% of listings, while pool tables and EV chargers were present in 5% and 3%, respectively. Lastly, basketball courts made up 4% of total listings.
When comparing the performance impact of amenities between different months of the year, distinct trends emerge. In July (peak season), multivariate analysis reveals that EV chargers have a highly positive impact, increasing revenue by approximately $3,429, while pools add $1,544 on average. Waterfront properties also increase revenue, with a positive impact of $689. Surprisingly, hot tubs have a negative impact on revenue in July, reducing it by $1,015.
In the off-season month of January, amenities contribute less to revenue with waterfront properties showing the only significant impact, lowering revenue by $471 on average. This shift suggests that while high-impact amenities like pools and EV chargers drive peak-season performance, they contribute little to demand during the off-season, where the property’s base appeal in design and size play an important role.
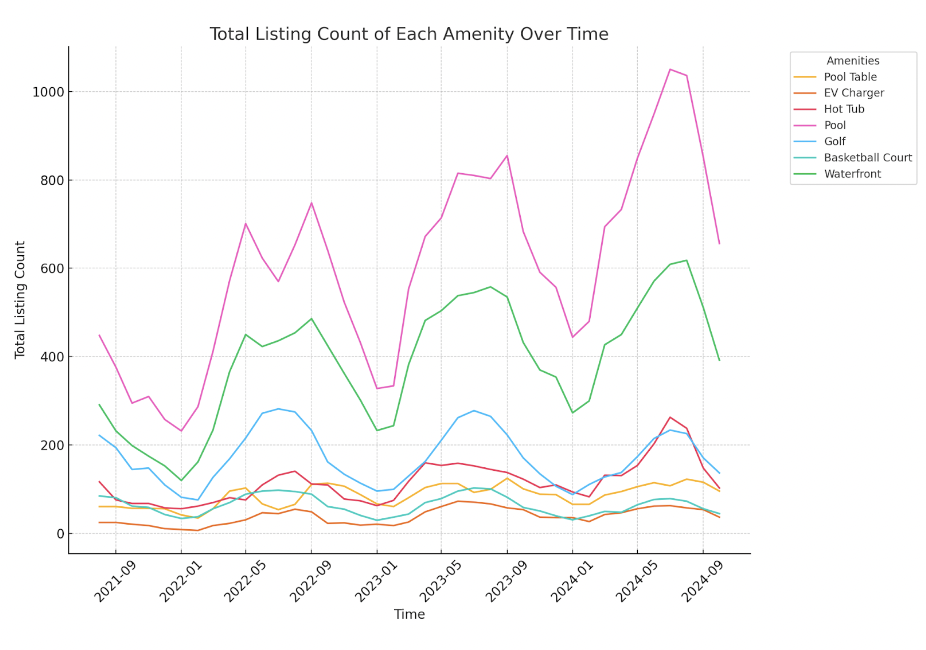
Additionally, the slight decrease in revenue associated with properties that have hot tubs during the peak season may result from property managers overvaluing this amenity in the current market. According to the multivariate analysis for July 2024, hot tubs are linked to a 12% reduction in occupancy and have a negligible impact on ADR.
Conclusion
Virginia Beach’s short-term rental market exhibits a clear pattern of growth, particularly during peak summer months. Units with 2- and 6-bedrooms currently offer some of the most favorable returns relative to the asset cost. By focusing on top-performing amenities and aligning property offerings with seasonal demand, investors and property managers can effectively capture and sustain high returns in this dynamic and growing market.
Get top STR deals delivered to your inbox!
Report by Michael Dreger
For more information email inquiry@revedy.com
Raw Data provided by KeyData

