Nestled along the shores of Lake Michigan, Traverse City is a charming destination known for its natural beauty. Renowned for its cherry orchards, wineries, and outdoor recreation, the city attracts travelers seeking adventure and relaxation. In this article, we explore what makes Traverse City’s short-term rental (STR) market unique, highlighting regulations, key trends, property insights, and strategies to succeed in this exceptional location.
Regulations
STRs are regulated to balance tourism with community standards and housing availability. There are two primary categories:
- Vacation Home Rentals: These are STRs permitted exclusively in designated commercial and development districts.
- Tourist Home Rentals: Defined as single-family dwellings that serve as the owner’s primary residence, where the owner is present during the rental period. This setup allows homeowners to rent out individual rooms or the entire unit while residing on-site.
In certain commercial districts, such as C-1 and C-2, STRs are capped at 25% of the total units. However, other districts like C-3 and C-4 currently have no such caps, though discussions are ongoing to potentially implement them.
Prospective operators must obtain a Vacation Home Rental License, which involves submitting an application with a $200 fee, providing necessary documentation, and passing a safety inspection by the Fire Marshal.
Market Overview
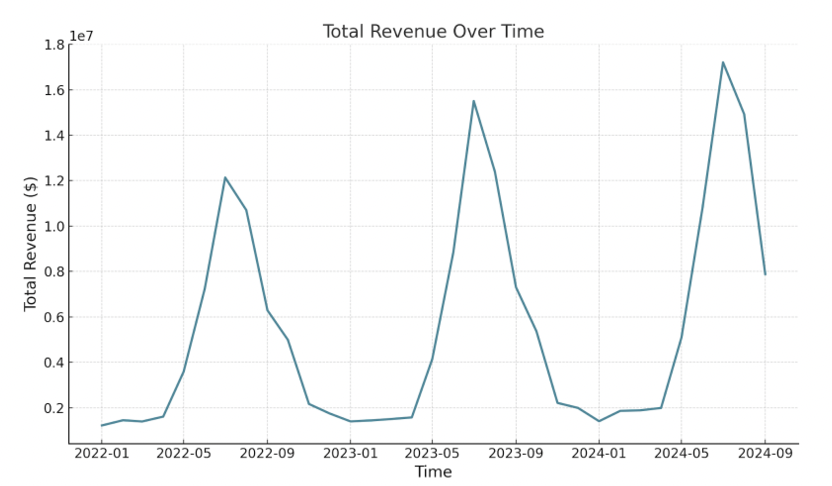
This market has demonstrated consistent growth over the past three years, with notable year-over-year increases in several key metrics. From July 2022 to July 2023, total revenue surged by an impressive 27.8%, climbing from $12.1 million to $15.5 million. This upward trend continued into July 2024, with a further increase of 11.0%, reaching $17.2 million. These figures highlight the market’s ability to expand and attract greater traveler spending year after year.
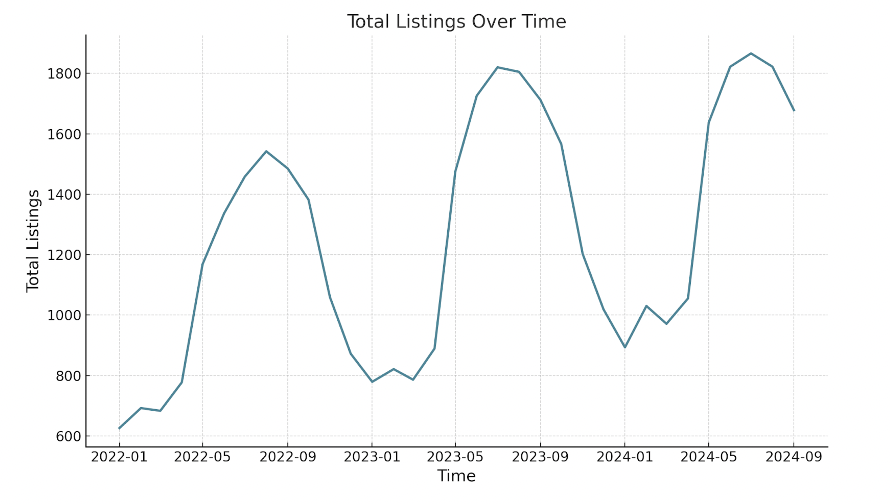
While the number of listings also grew, the rate of growth slowed due to increasing regulatory challenges. Listings rose by 24.8% between 2022 and 2023 but grew only marginally by 2.5% from 2023 to 2024. This slowdown has created a more competitive environment for existing hosts, ultimately benefiting investors who have maintained their properties.
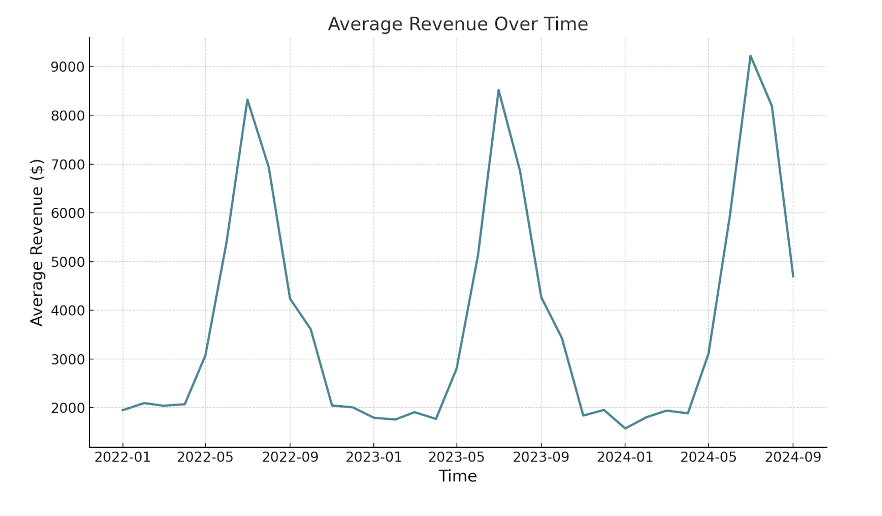
A closer examination of average revenue per listing underscores this trend. From July 2022 to July 2023, average revenue per listing grew by 2.4%, rising from approximately $8,305 to $8,503. However, the most dramatic improvement occurred between July 2023 and July 2024, when average revenue jumped by 8.3%, reaching $9,202 per listing. This substantial increase in 2024 reflects the growing profitability of individual properties in the face of tightening market regulations.
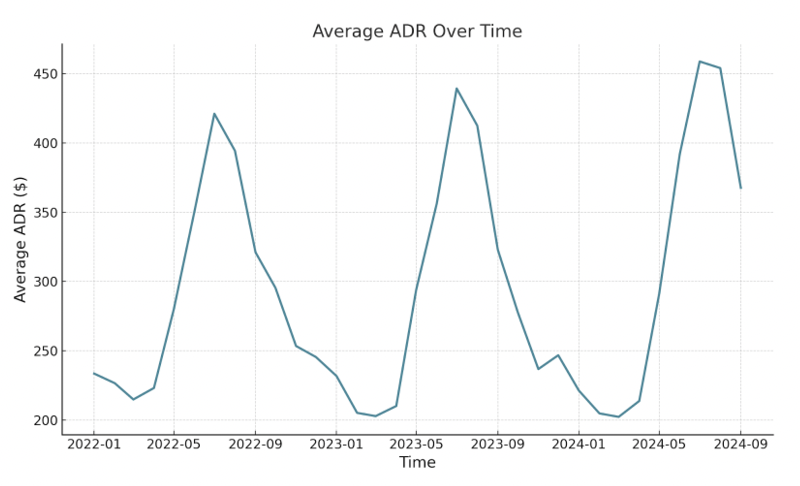
The primary driver behind this growth in average investor returns has been the ability of hosts to strategically raise the average daily rate (ADR) without experiencing negative impacts on occupancy rates. From July 2022 to July 2023, ADR rose by 4.3%, increasing from $421 to $439, and it continued to climb by another 4.4% to $459 in July 2024. Remarkably, these price adjustments did not negatively impact guests’ proclivity to book. Occupancy rates, which dipped slightly by 1.8% from 2022 to 2023, rebounded with a 2.8% increase in 2024, stabilizing at approximately 67.5%.
Property Type Analysis
The data reveals that 1- and 2-bedroom properties dominate the market, collectively accounting for over 64% of listings. This saturation creates stiff competition among hosts in these categories, requiring a focus on differentiation through pricing, amenities, design, or marketing strategies. Meanwhile, 3-bedroom properties represent 19.3% of the market, making them less saturated yet still in a competitive range.
Larger properties, such as those with 4, 5, or 6 bedrooms, are significantly less represented, collectively making up only about 14% of listings. These properties face less competition, offering a potential advantage for those targeting niche groups like families or larger traveler parties.
The market average gross yields provide further insights into profitability:
- 1-bedroom: 11.4%
- 2-bedroom: 13.5%
- 3-bedroom: 14.4%
- 4-bedroom: 12.9%
- 5-bedroom: 11.0%
- 6-bedroom: 8.5%
Note that these values are all based on market averages, and with strategic decisions, any property can achieve premium returns. To understand investment-grade revenue for individual assets in this market, underwrite short-term rentals using Revedy AI.
Amenity Analysis
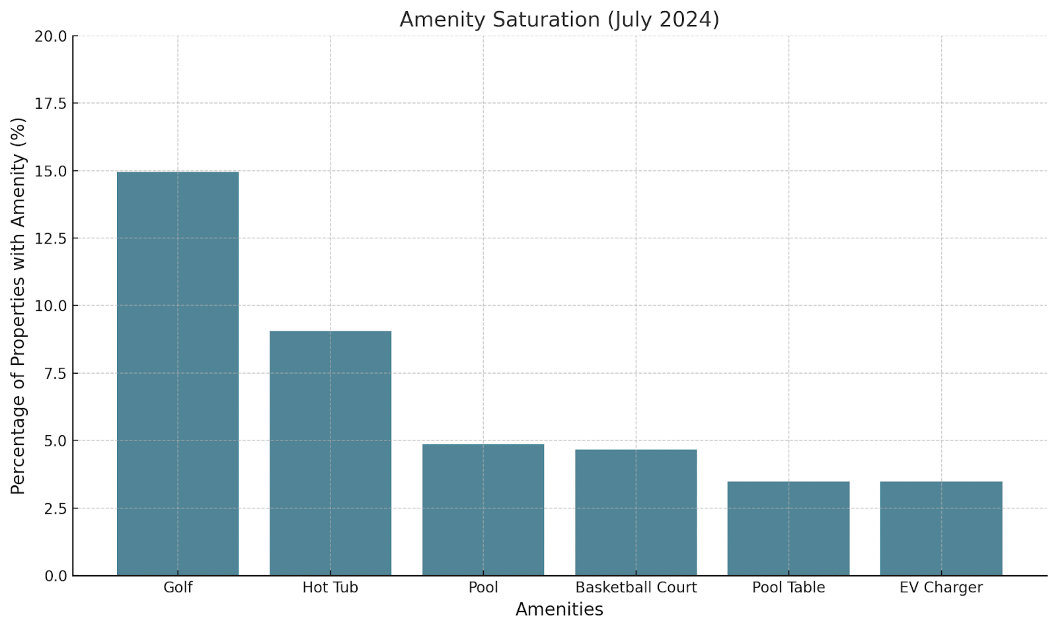
Regarding amenities, properties offering golf amenities were the most common, accounting for 279 listings (15% of the market). Hot tubs were the next most prevalent, available in 169 properties (9%). Pools and basketball courts were each present in 91 and 87 properties respectively, making up about 5% of listings. Meanwhile, pool tables and EV chargers were less common, with only 65 properties (3%) featuring each of these amenities.
Revenue data from January and July 2024 reveals the impact of these amenities on property earnings across the peak and off-season. In January (off-season), EV chargers and hot tubs were standout features, adding approximately $785 and $723 to monthly revenue, respectively, with strong statistical significance. While pool tables contributed $273 on average, their impact was not statistically significant. Interestingly, basketball courts showed a minor negative revenue impact of $76, though this result was also not statistically meaningful.
In July, the revenue impact of certain amenities increased dramatically. EV chargers and hot tubs continued to shine, adding $2,833 and $2,053 to monthly revenue on average, highlighting their value during the peak summer season. Other features like basketball courts added $205, though their impact remained modest. Pool tables, in contrast, were associated with a slight revenue decrease of $235.
Property owners in Traverse City should prioritize adding high-value amenities like EV chargers and hot tubs to maximize revenue potential, particularly during peak travel months like July. Investing in these features can help listings stand out in a competitive market, while less impactful amenities should be considered only if they align with niche guest demands.
Conclusion
The Traverse City STR market presents a compelling opportunity for investors, thanks to its steady revenue growth, rising average daily rates, and consistent guest demand. While regulatory measures add a layer of complexity, it creates a competitive advantage for those who can adapt to the evolving landscape. Focusing on properties with 2-3 bedrooms, adding high-impact amenities like EV chargers and hot tubs, and targeting niche audiences with larger properties can help maximize their returns.
Get top STR deals delivered to your inbox!
Report by Michael Dreger
For more information email inquiry@revedy.com

