
The Smoky Mountain region has witnessed a remarkable surge in its short-term rental (STR) market, characterized by a consistent growth in property listings and evolving revenue dynamics. The overall supply of STRs has expanded significantly, with both investment-grade* and non-investment-grade properties experiencing substantial increases. The growth in listings has been accompanied by shifts in revenue, with a notable divergence between investment-grade and non-investment-grade properties. The following analysis delves into the multifaceted landscape of the Smoky Mountain STR market. It will explore the interplay of supply, revenue, and property attributes that shape property performance.
*Investment-grade assets are defined as STRs operating year-round, being well-managed (e.g. optimized occupancy) and proven operational excellence (e.g. great reviews).
Supply Overview
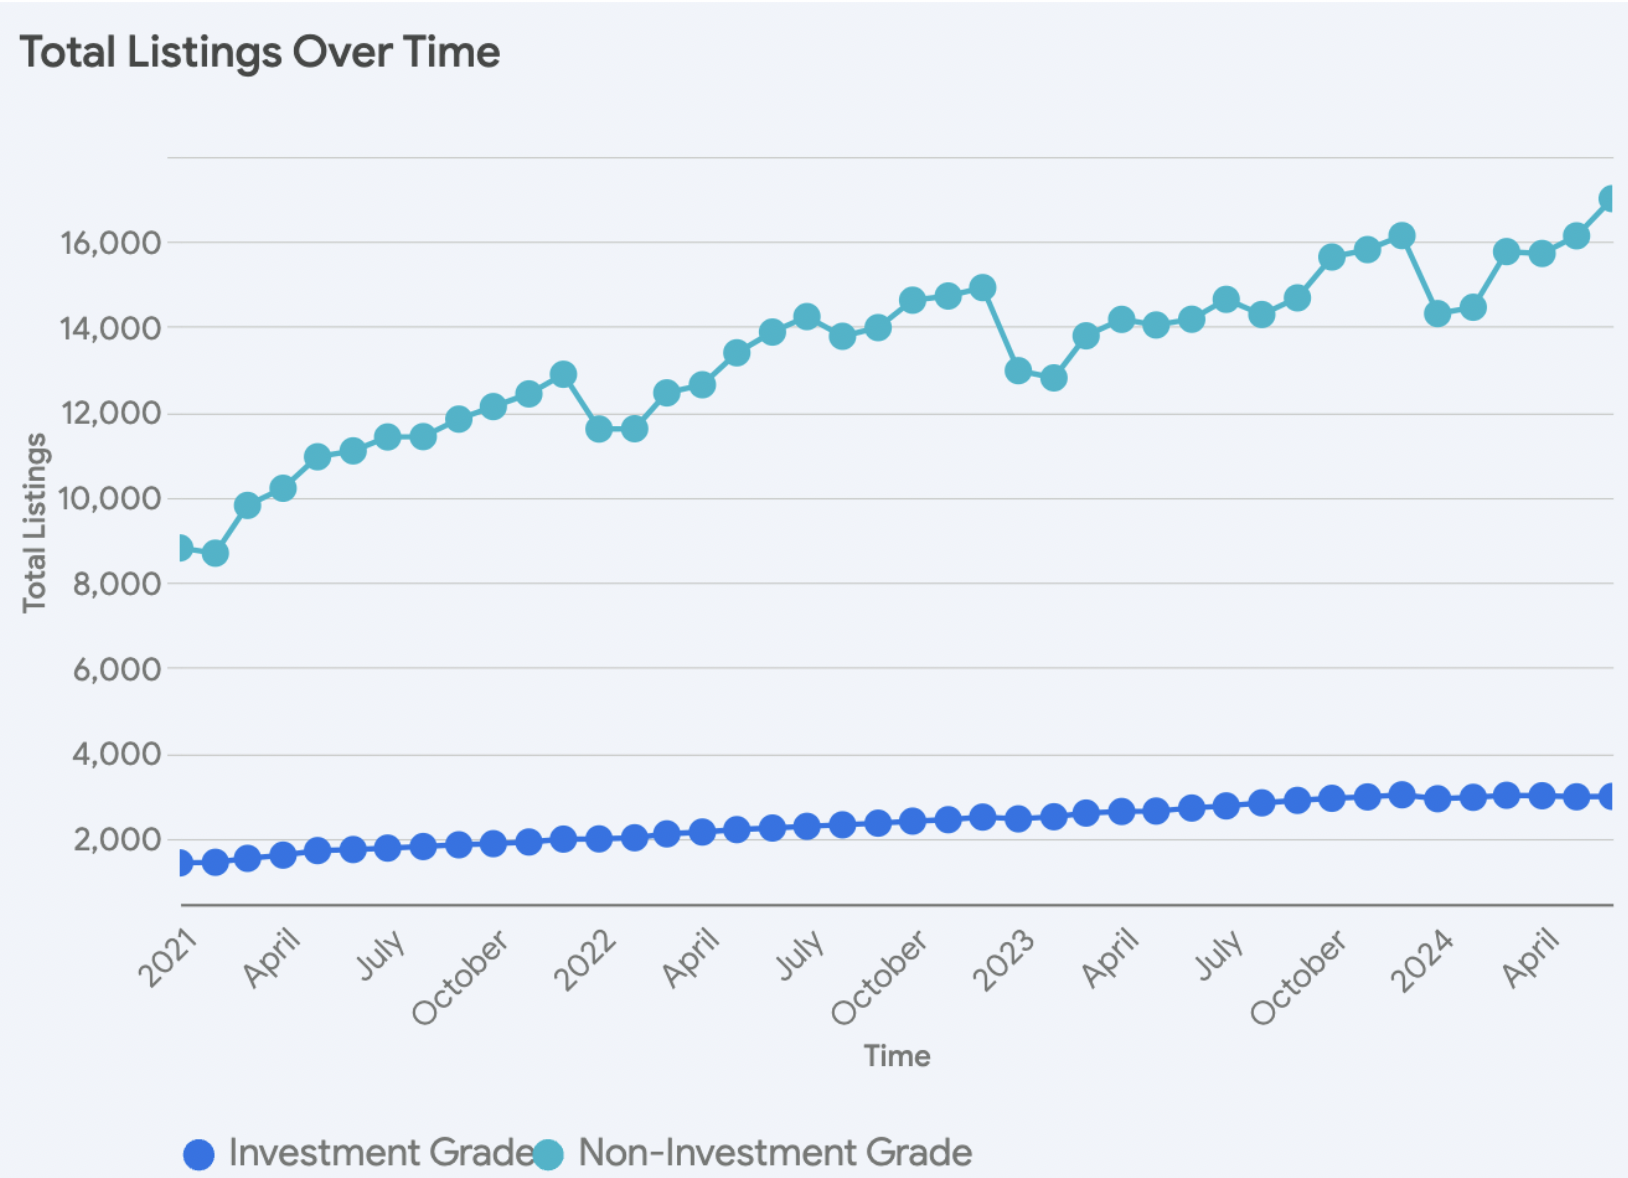
There has been a consistent growth in the overall number of properties listed over time in the Smoky Mountain STR market.
Non-investment-grade properties, constituting the majority of listings, have seen a substantial rise from around 8,800 in January 2021 to over 17,000 by June 2024. This translates to an impressive increase of approximately 93%.
The investment-grade property count also shows an upward trajectory. Starting from around 1,400 listings in early 2021, it reached close to 3,000 by mid-2024, marking an increase of about 114%.
Property Type Saturation
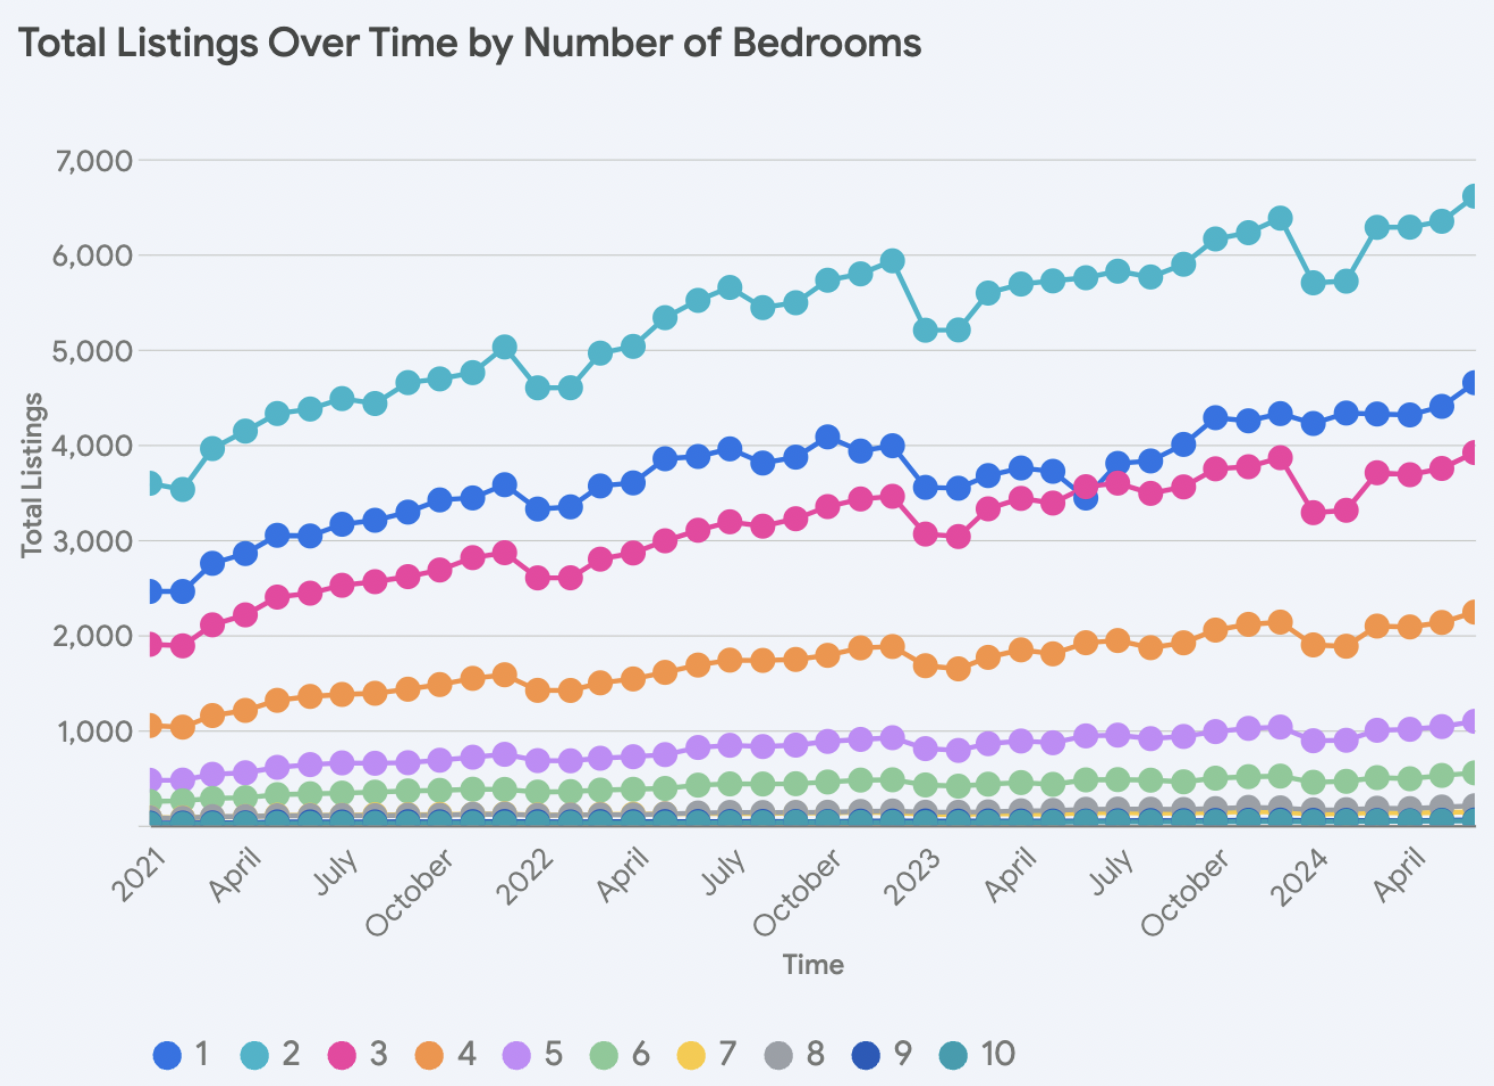
There has been consistent growth in property counts across all bedroom categories from January 2021 to June 2024. Properties with 2 bedrooms have consistently been the most numerous, exhibiting a remarkable surge of 84% from approximately 3,600 listings in early 2021 to over 6,600 by mid-2024.
Following closely are 1-bedroom properties, which also witnessed substantial growth (89% increase), from around 2,500 listings to over 4,600.
The 3-bedroom category trails in third place, expanding from about 1,900 listings to about 3,900, and properties with 4 bedrooms saw their numbers grow from roughly 1,000 to over 2,200.
Listings with 5 or more bedrooms, while starting from a lower base, also demonstrated notable growth. For instance, 5-bedroom properties increased by approximately 131%, from around 500 to nearly 1,100.
Performance Overview
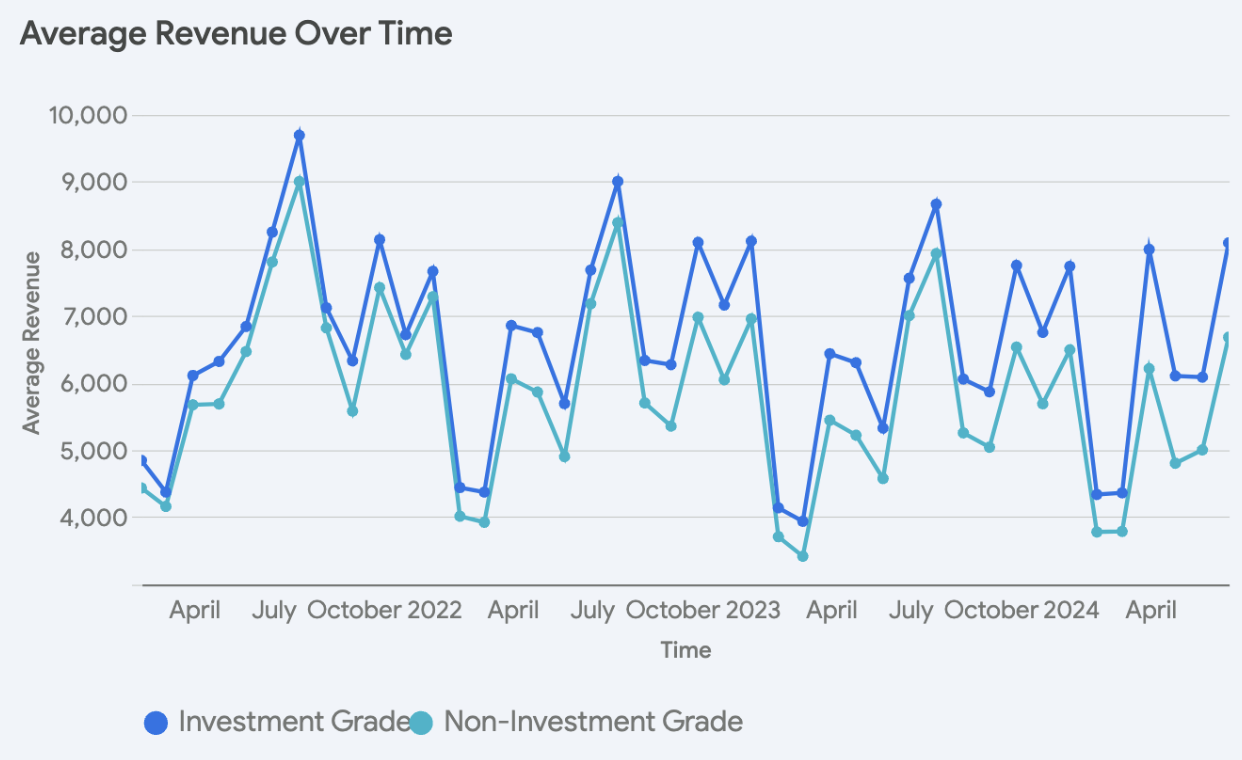
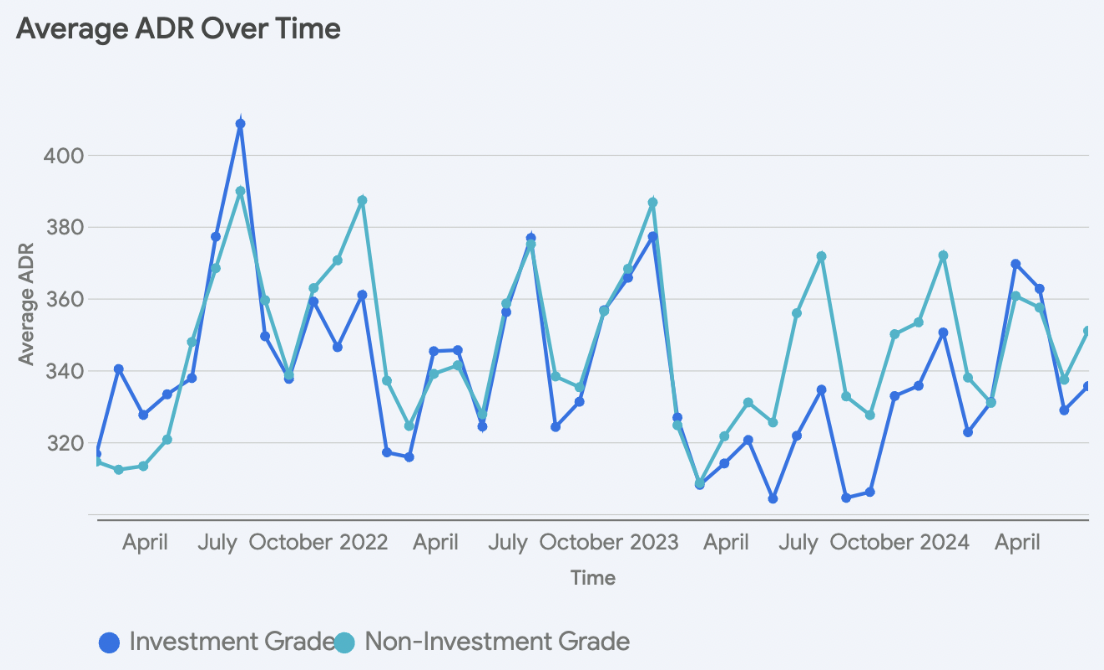
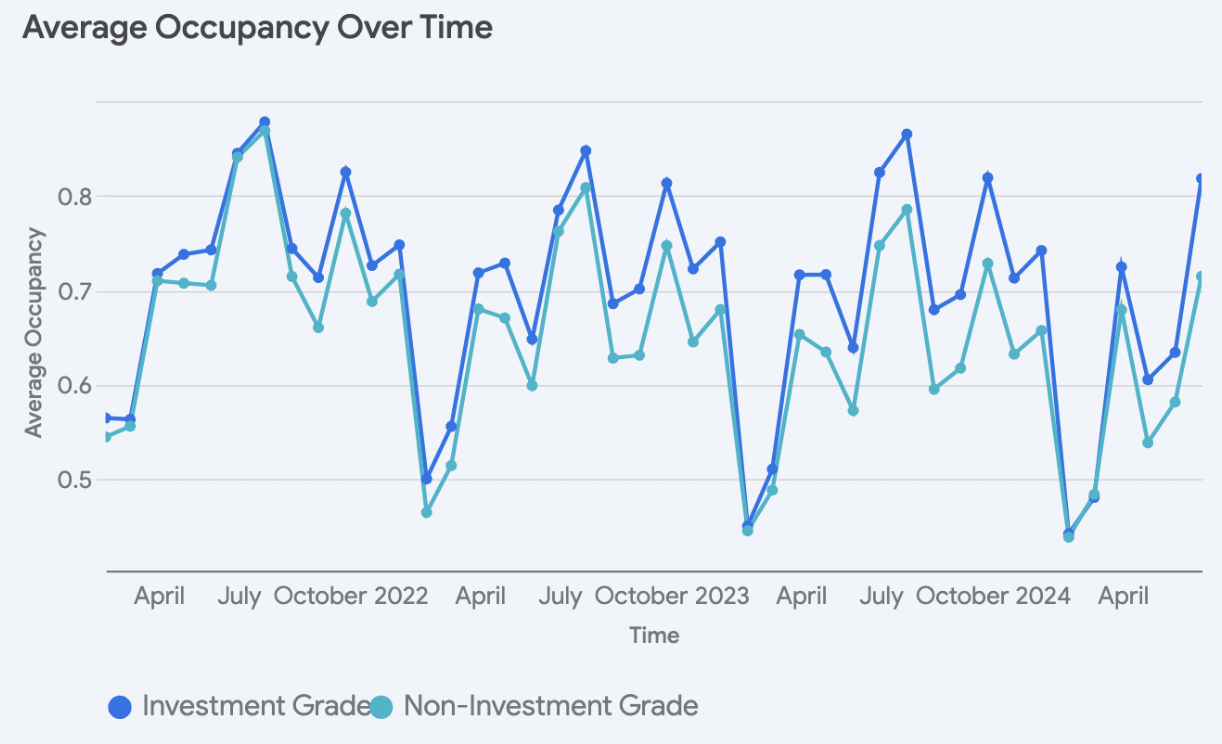
In June 2021, investment-grade properties commanded an average revenue of $8,242, outperforming non-investment-grade properties which averaged $7,797. This indicates a premium of roughly $445 for investment-grade STRs during that period. Additionally, investment-grade properties commanded a slightly higher Average Daily Rate (ADR) of $377 compared to non-investment-grade properties at $368. Both categories enjoyed healthy occupancy rates, with investment-grade properties at 85% and non-investment-grade at 84%.
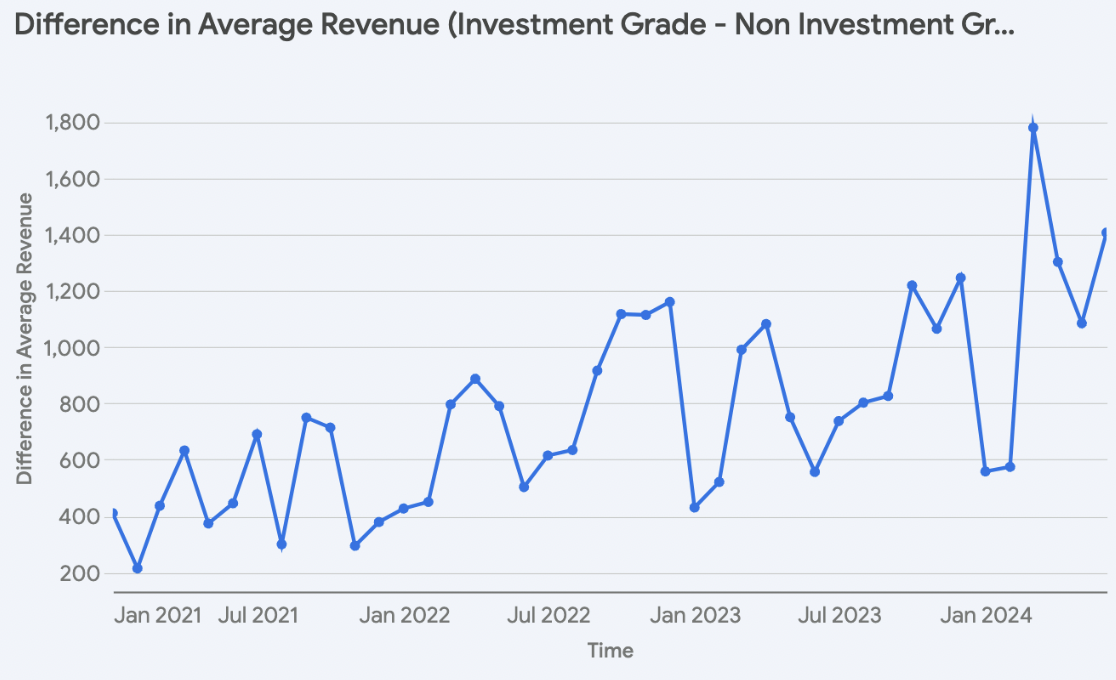
However, the landscape has shifted notably since. In June 2024, both asset classes experienced a decline in average revenue. The average revenue for investment-grade assets has dipped to $8,082 and non-investment-grade properties have seen a steeper decline to $6,676. Yet, the revenue difference for investment-grade assets over non-investment-grade has grown to approximately $1,405, more than tripling the 2021 figure.
This bifurcation of revenue between investment-grade and non-investment-grade assets is attributed to differences in revenue management. For instance, while both assets experienced a decrease in ADR, non-investment-grade properties now have a higher ADR ($351) than investment-grade assets ($335). The impacts of this are viewed in occupancy levels where investment-grade assets have retained similar occupancy to 2021, reporting 82%. In contrast, non-investment-grade properties witnessed a significant drop to 71%.
Impact of Property Type
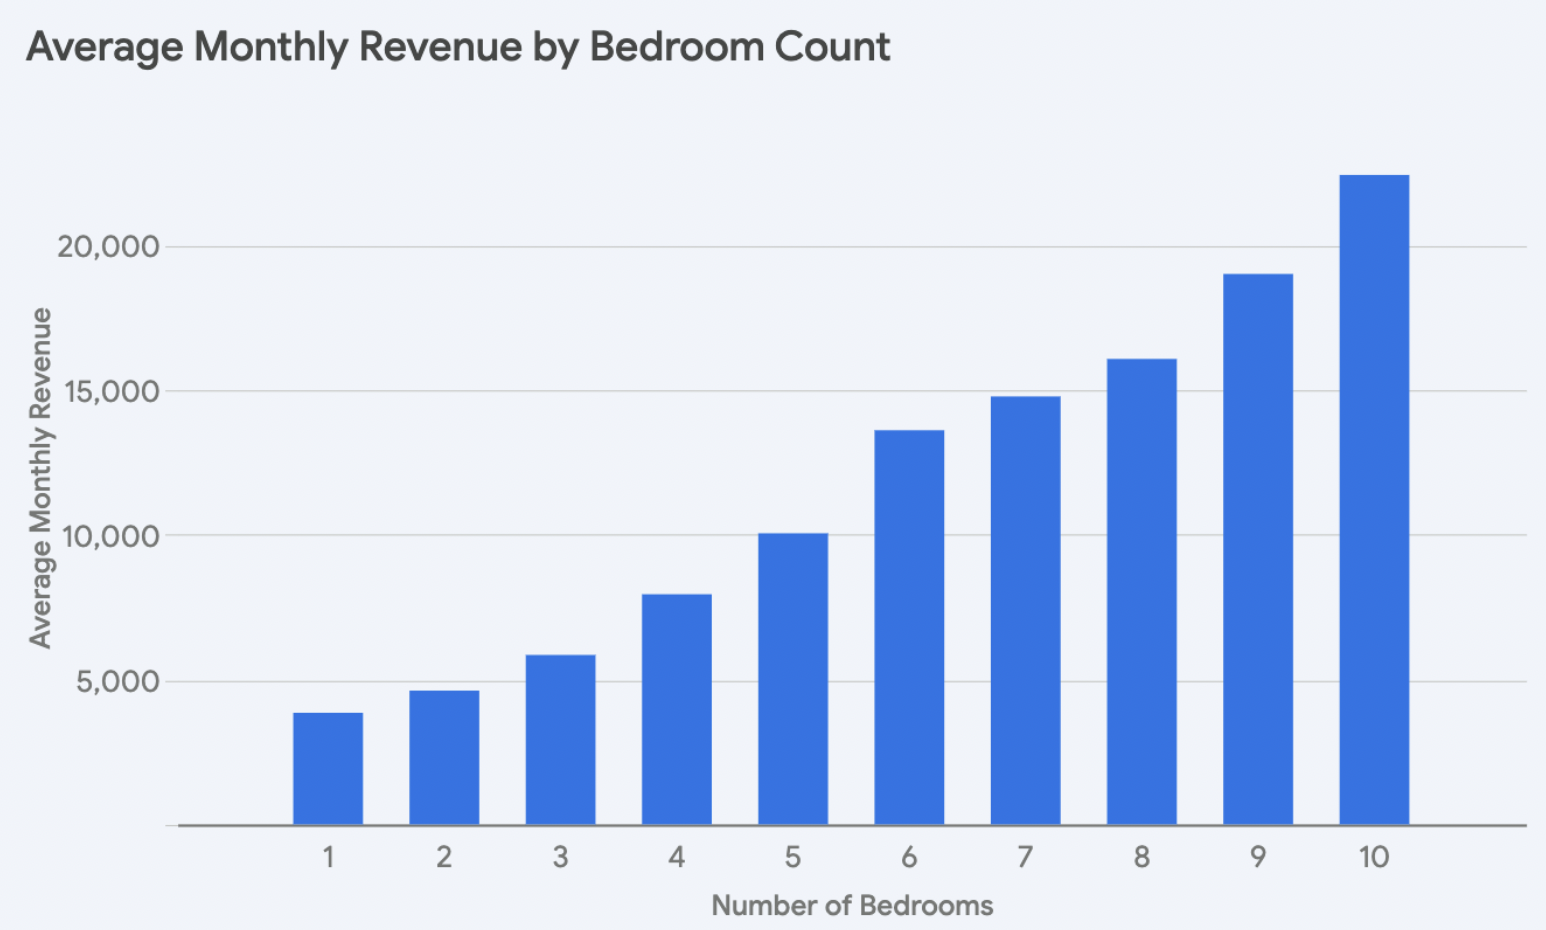
It is notable that properties with higher bedroom counts command higher average monthly revenues. This is supported by a correlation of 0.511 between the number of bedrooms and average monthly revenue and is consistently observed across properties with one to ten bedrooms, with each additional bedroom translating to a significant increase in average revenue.
However, there is a slight anomaly in this trend for 6-bedroom and 7-bedroom properties. While we would expect a substantial increase in revenue with an additional bedroom, the increase from 6 bedrooms ($13,620) to 7 bedrooms ($14,788) is relatively smaller compared to other jumps.
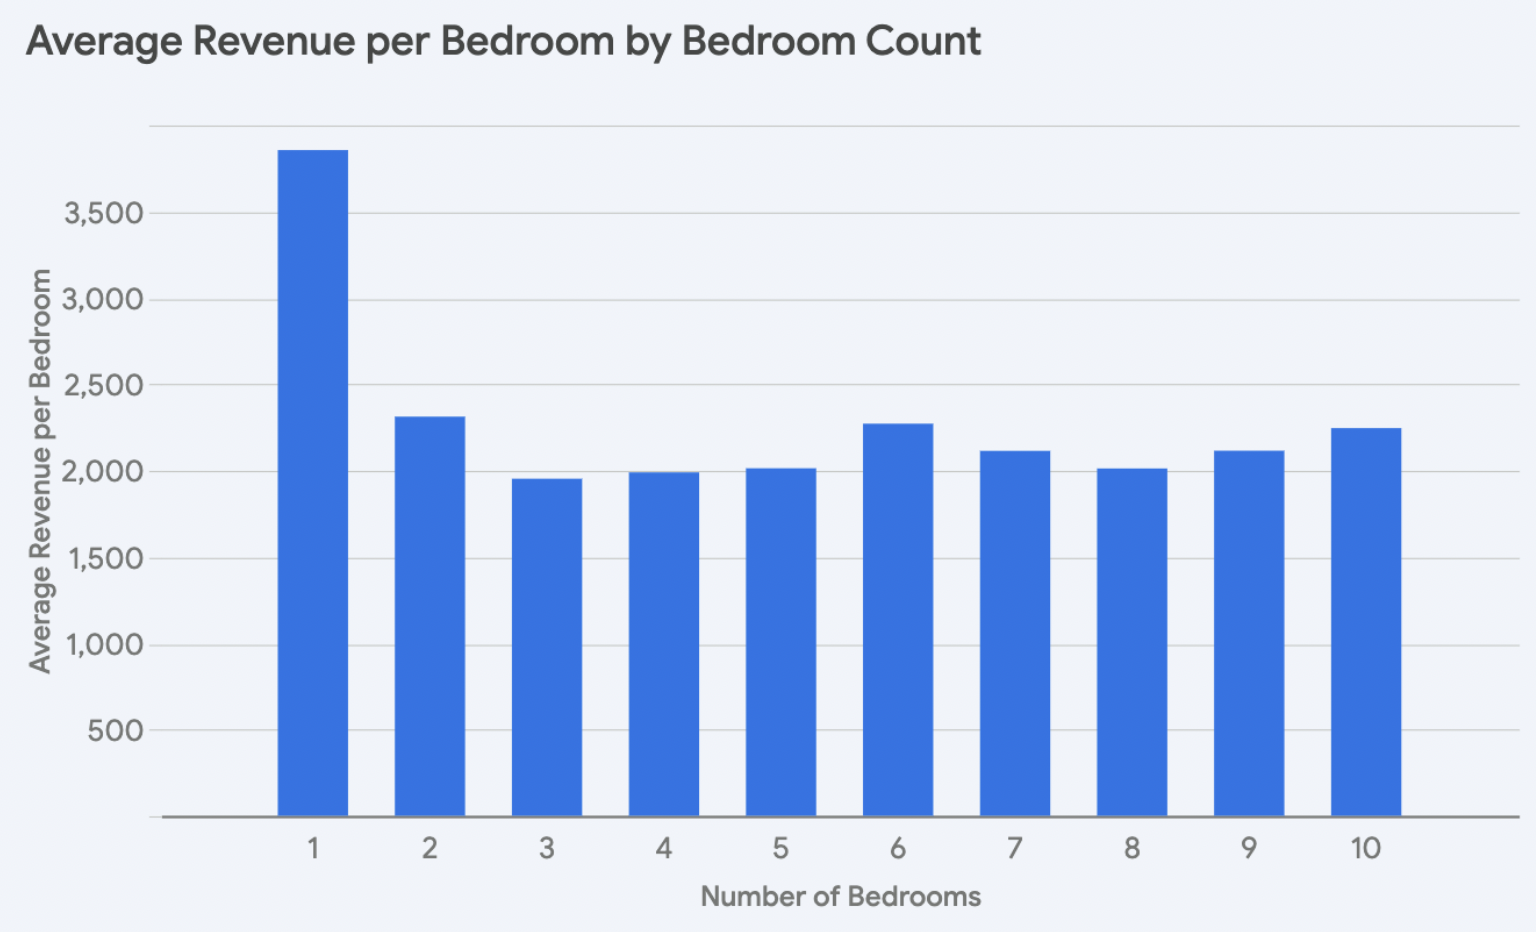
In this market, the linear relationship between the average monthly revenue and the number of bedrooms in a property results in a relatively consistent efficiency across properties in terms of revenue per bedroom. Notably, properties with a single bedroom stand out as the most efficient in terms of revenue generation per bedroom. Such a trend is uncommon for STR markets as there is usually greater differentiation across assets and indicates that there is ample demand for different sized listings in this region.
Impact of Location
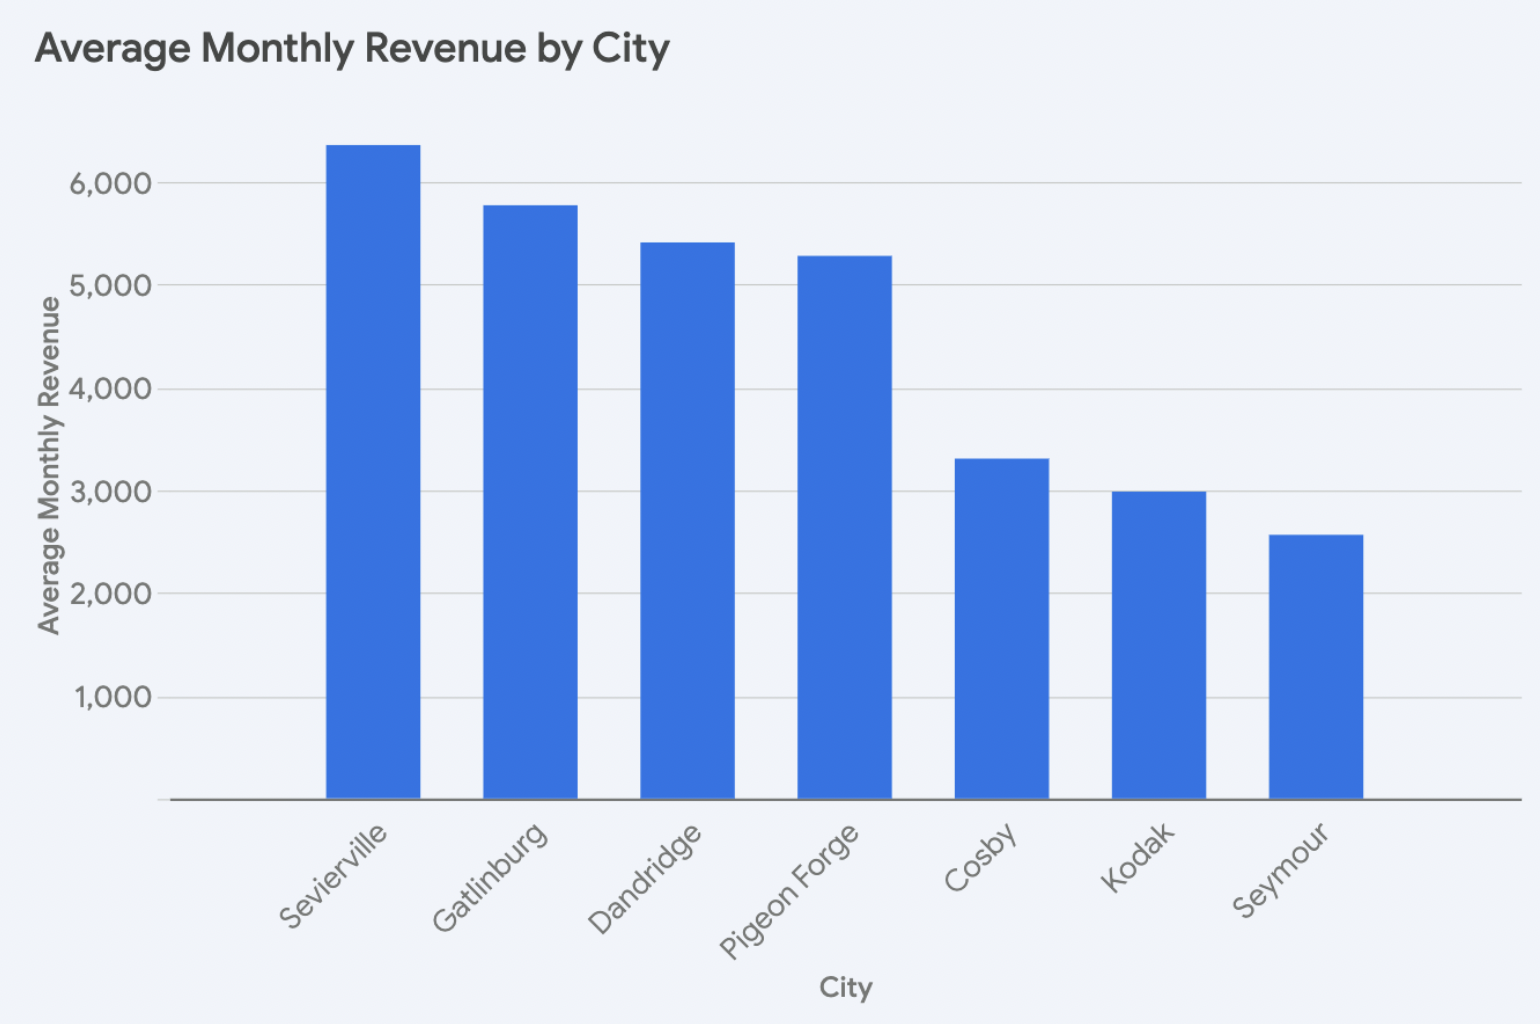
In the Smoky Mountain region, we note that Sevierville commands the highest average revenue, boasting an impressive average of $6,358 per listing. Following closely is Gatlinburg, with an average revenue of $5,772. Dandridge is third with an average monthly revenue of $5,410, trailing Sevierville by about 14.9%. Pigeon Forge ranks fourth with an average monthly revenue of $5,280. The remaining cities, Cosby, Kodak, and Seymour, exhibit notably less average revenue, ranging from $2,565.48 to $3,307.36.
Impact of Amenities
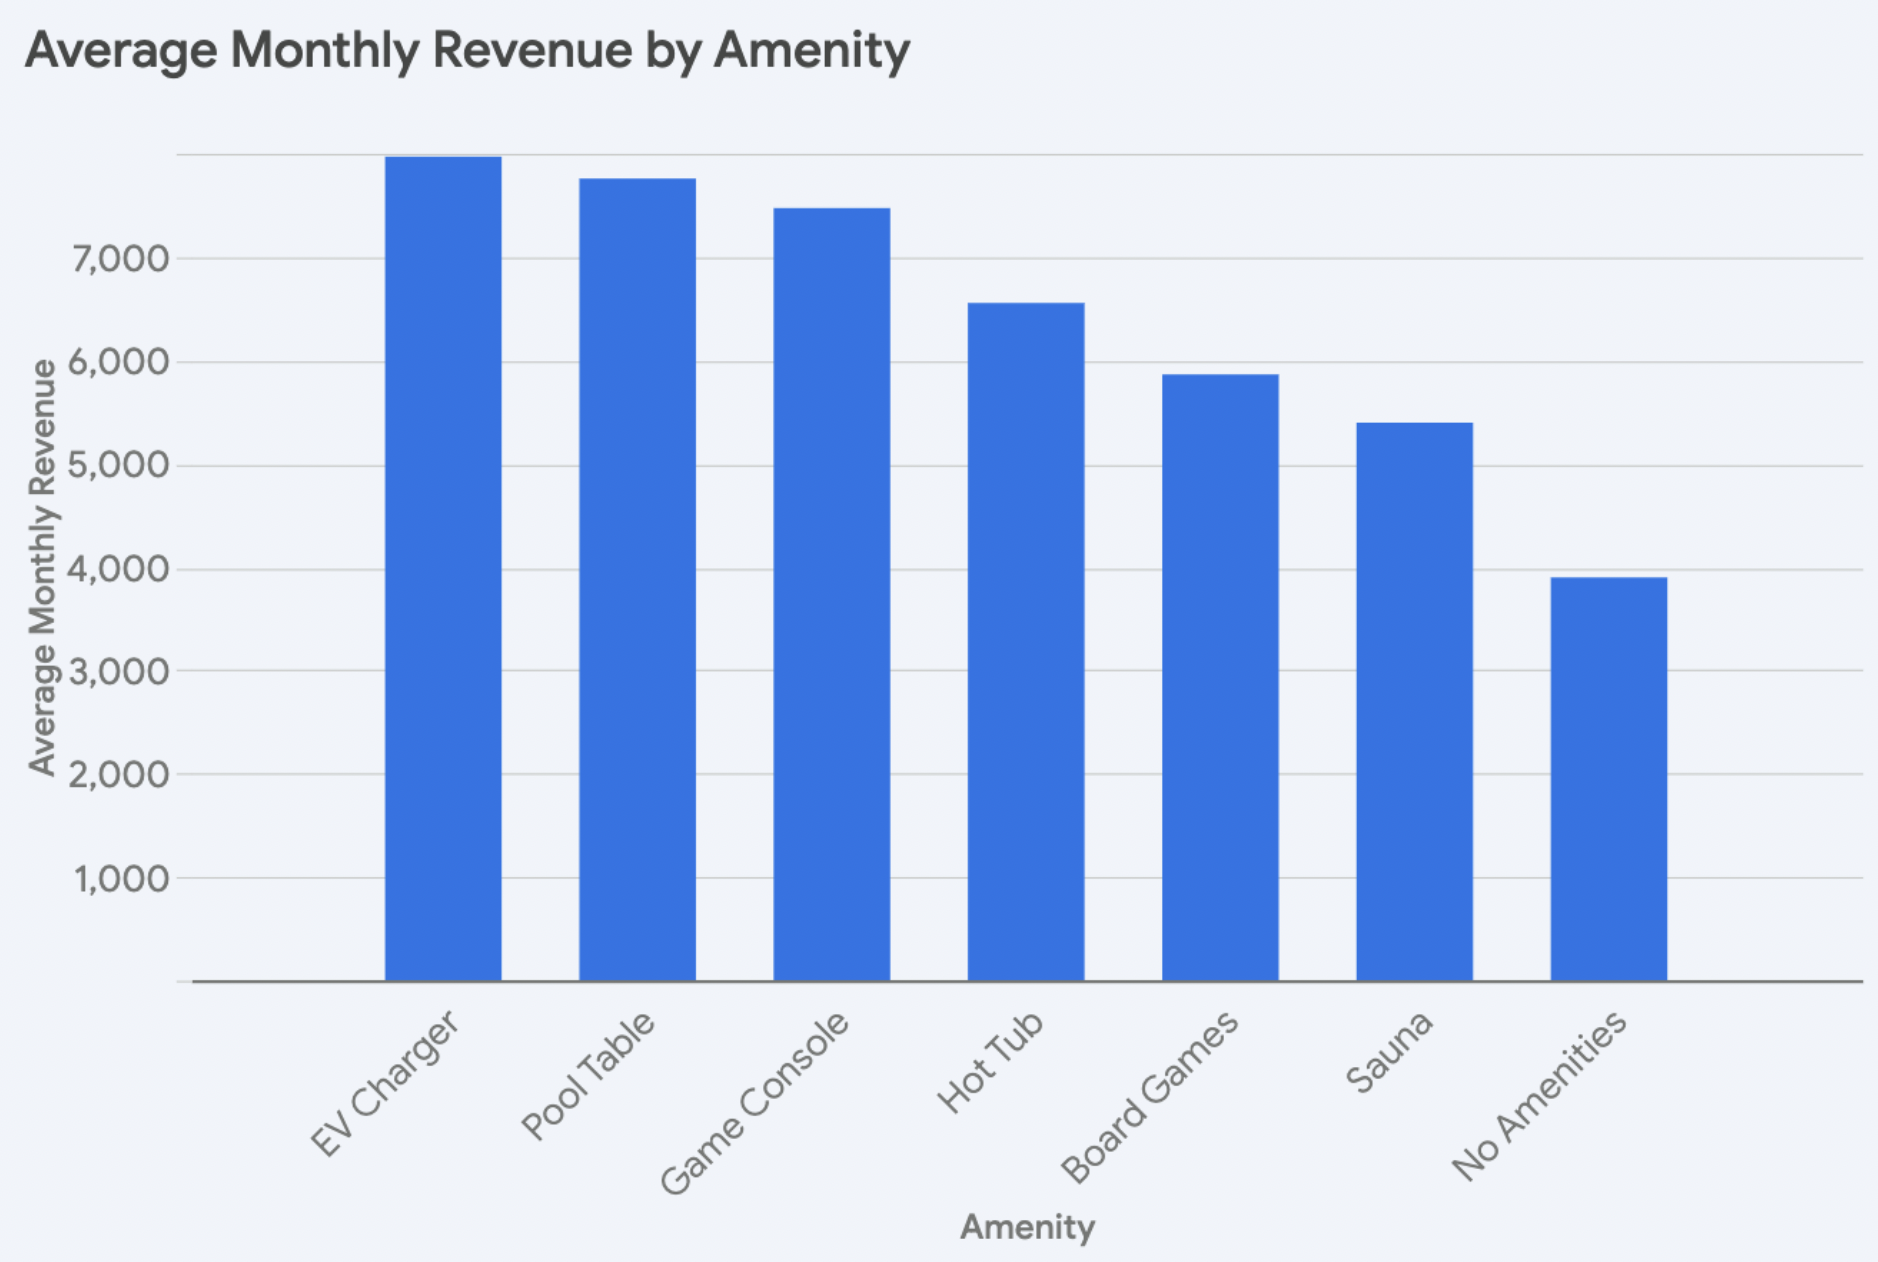
Properties with an electric vehicle (EV) charger command the highest average monthly revenue at $7,965, followed closely by those with a pool table at $7,754.
The remaining amenities – sauna, hot tub, game console, and board games – fall somewhere in between, with average monthly revenues ranging from $5,392 to $7,468. Although these amenities may not generate as much additional revenue as a pool table or EV charger, they still enhance a property’s attractiveness and can appeal to a broader range of guests.
Properties without any amenities generate the lowest average monthly revenue at $3,895.
Amenity Saturation
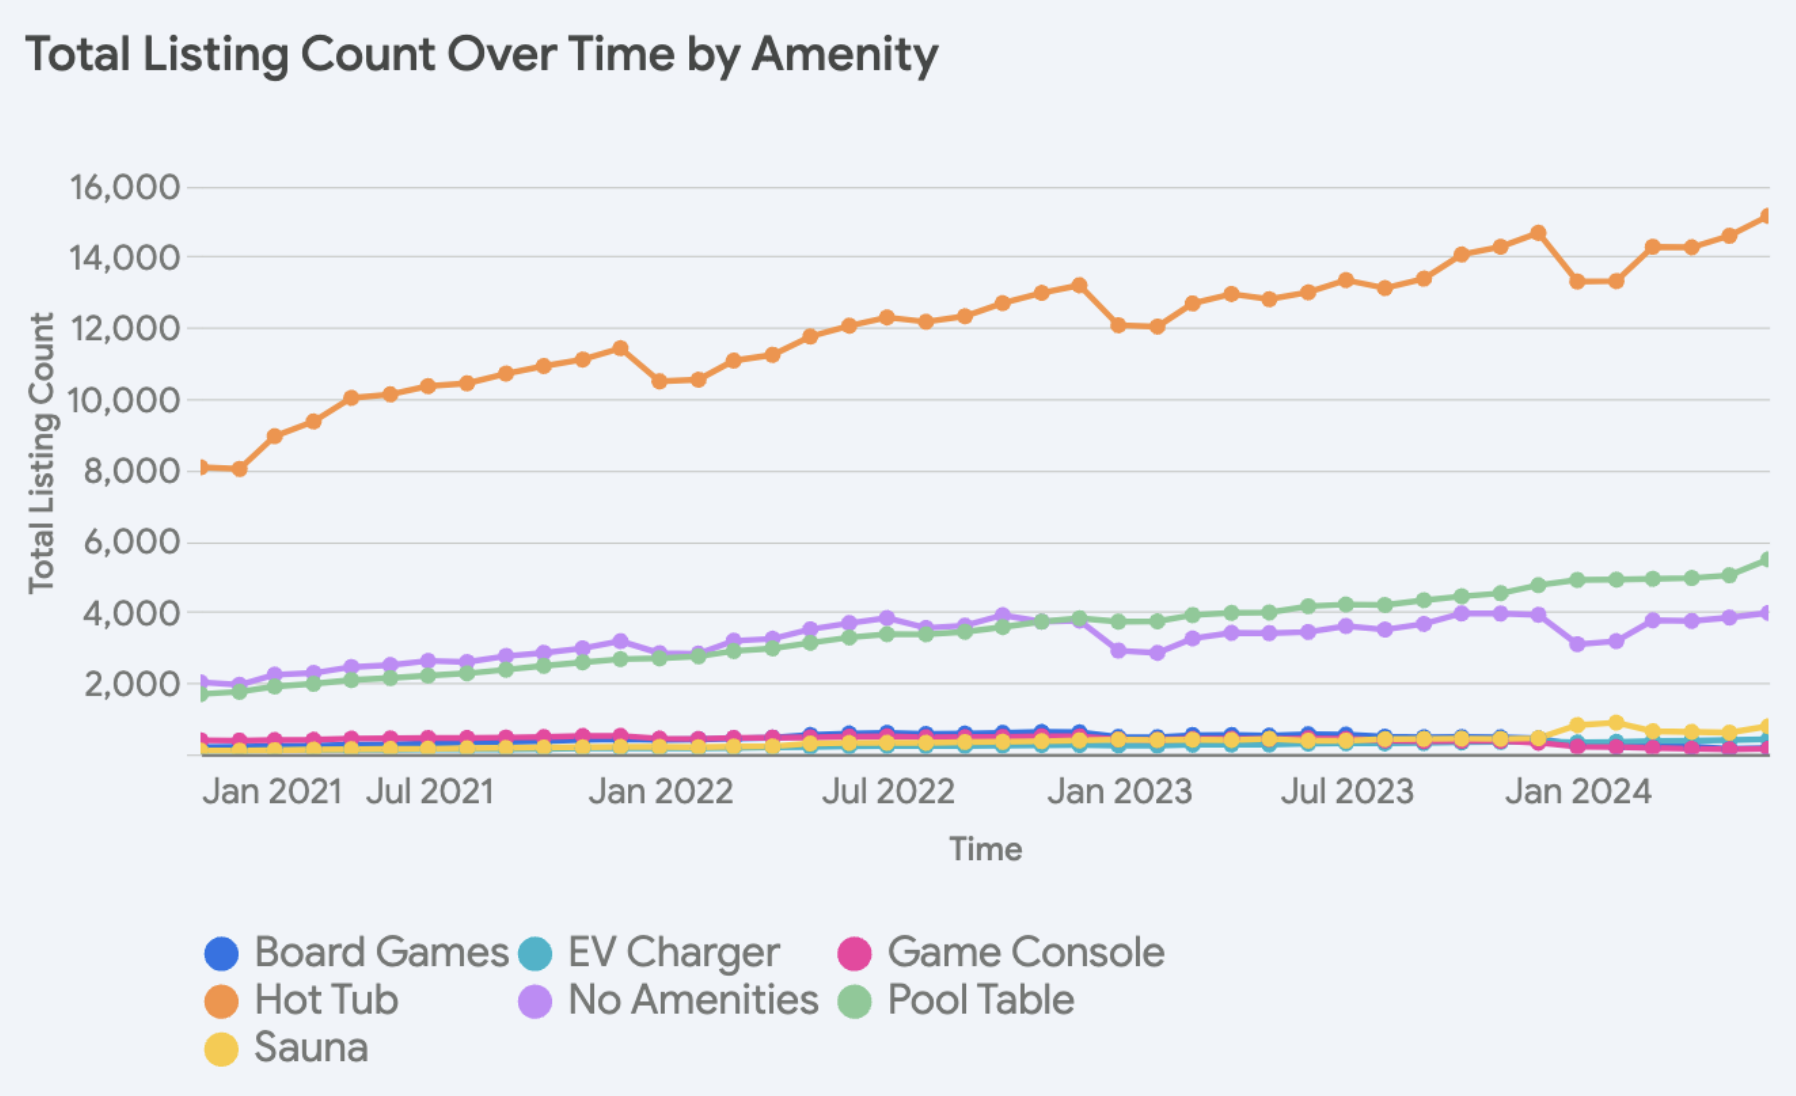
Between 2021 and 2024, hot tubs have remained a favorite, showcasing a steady and substantial increase in prevalence and surging by an impressive 87%.
Yet, the most dramatic transformation has been the rise of saunas, EV chargers, and pool tables. EV chargers experienced significant growth of 367% and saunas grew by an astronomical 752%. Pool tables increased by 225%.
In contrast, game consoles and board games have declined by 62% and 16%, respectively.
Conclusion
The Smoky Mountain STR market presents a dynamic landscape characterized by growth, evolving revenue patterns, and the influence of property attributes and amenities. The consistent increase in listings, particularly in the non-investment-grade segment, underscores the region’s attractiveness for property owners. However, the revenue picture is more nuanced, with a growing disparity between investment-grade and non-investment-grade properties.
The analysis also highlights the impact of property characteristics on revenue. Larger properties with more bedrooms generally command higher average monthly revenue. Location also plays a crucial role, with Sevierville leading in average revenue, followed by Dandridge and Gatlinburg. Additionally, the presence of amenities like pool tables and EV chargers can significantly boost a property’s earning potential, while the absence of amenities can negatively impact revenue.
INTERESTED IN SMOKY MOUNTAIN STRs
Let us help you find high-performing vacation homes in the area
Report by Michael Dreger
For more information email inquiry@revedy.com