
The Shenandoah Valley of Virginia, renowned for its natural beauty and rich history, presents a growing opportunity for short-term rental (STR) investors.
However, success in this market requires more than just capitalizing on the scenery. It demands a deep understanding of diverse local regulations, evolving market trends, and the specific factors driving guest demand. This article provides a data-driven roadmap for navigating the Shenandoah Valley STR market, helping you make informed decisions to maximize your investment returns.

NAVIGATING REGULATIONS
The Shenandoah Valley’s regulatory landscape is characterized by its variability. Each county and town within the region sets its own STR ordinances, leading to significant differences even within short distances. This decentralized approach necessitates thorough research before investing in any specific area.
Most localities define STRs as lodgings rented for fewer than 30 consecutive days and require operators to collect a Transient Occupancy Tax (TOT). Many also mandate permits or registration. For example:
- Shenandoah County: Requires an annual permit for smaller STRs outside of towns, monthly tax reporting, and adherence to safety standards.
- Augusta County: Requires STRs to be primary residences.
- Rockingham County: Currently has no specific STR regulations beyond TOT collection.
- Towns (e.g., Shenandoah, Luray): Often have their own permit and tax requirements, sometimes including business licenses.
To be safe in your investment, contact the zoning department of the specific county or town they are interested in. Verify zoning rules, permit procedures, tax obligations, and any safety or operational requirements. Checking for Homeowner Association (HOA) restrictions is also essential. Revedy also provides comprehensive regulation report reports available to order on our website here.
MARKET OVERVIEW
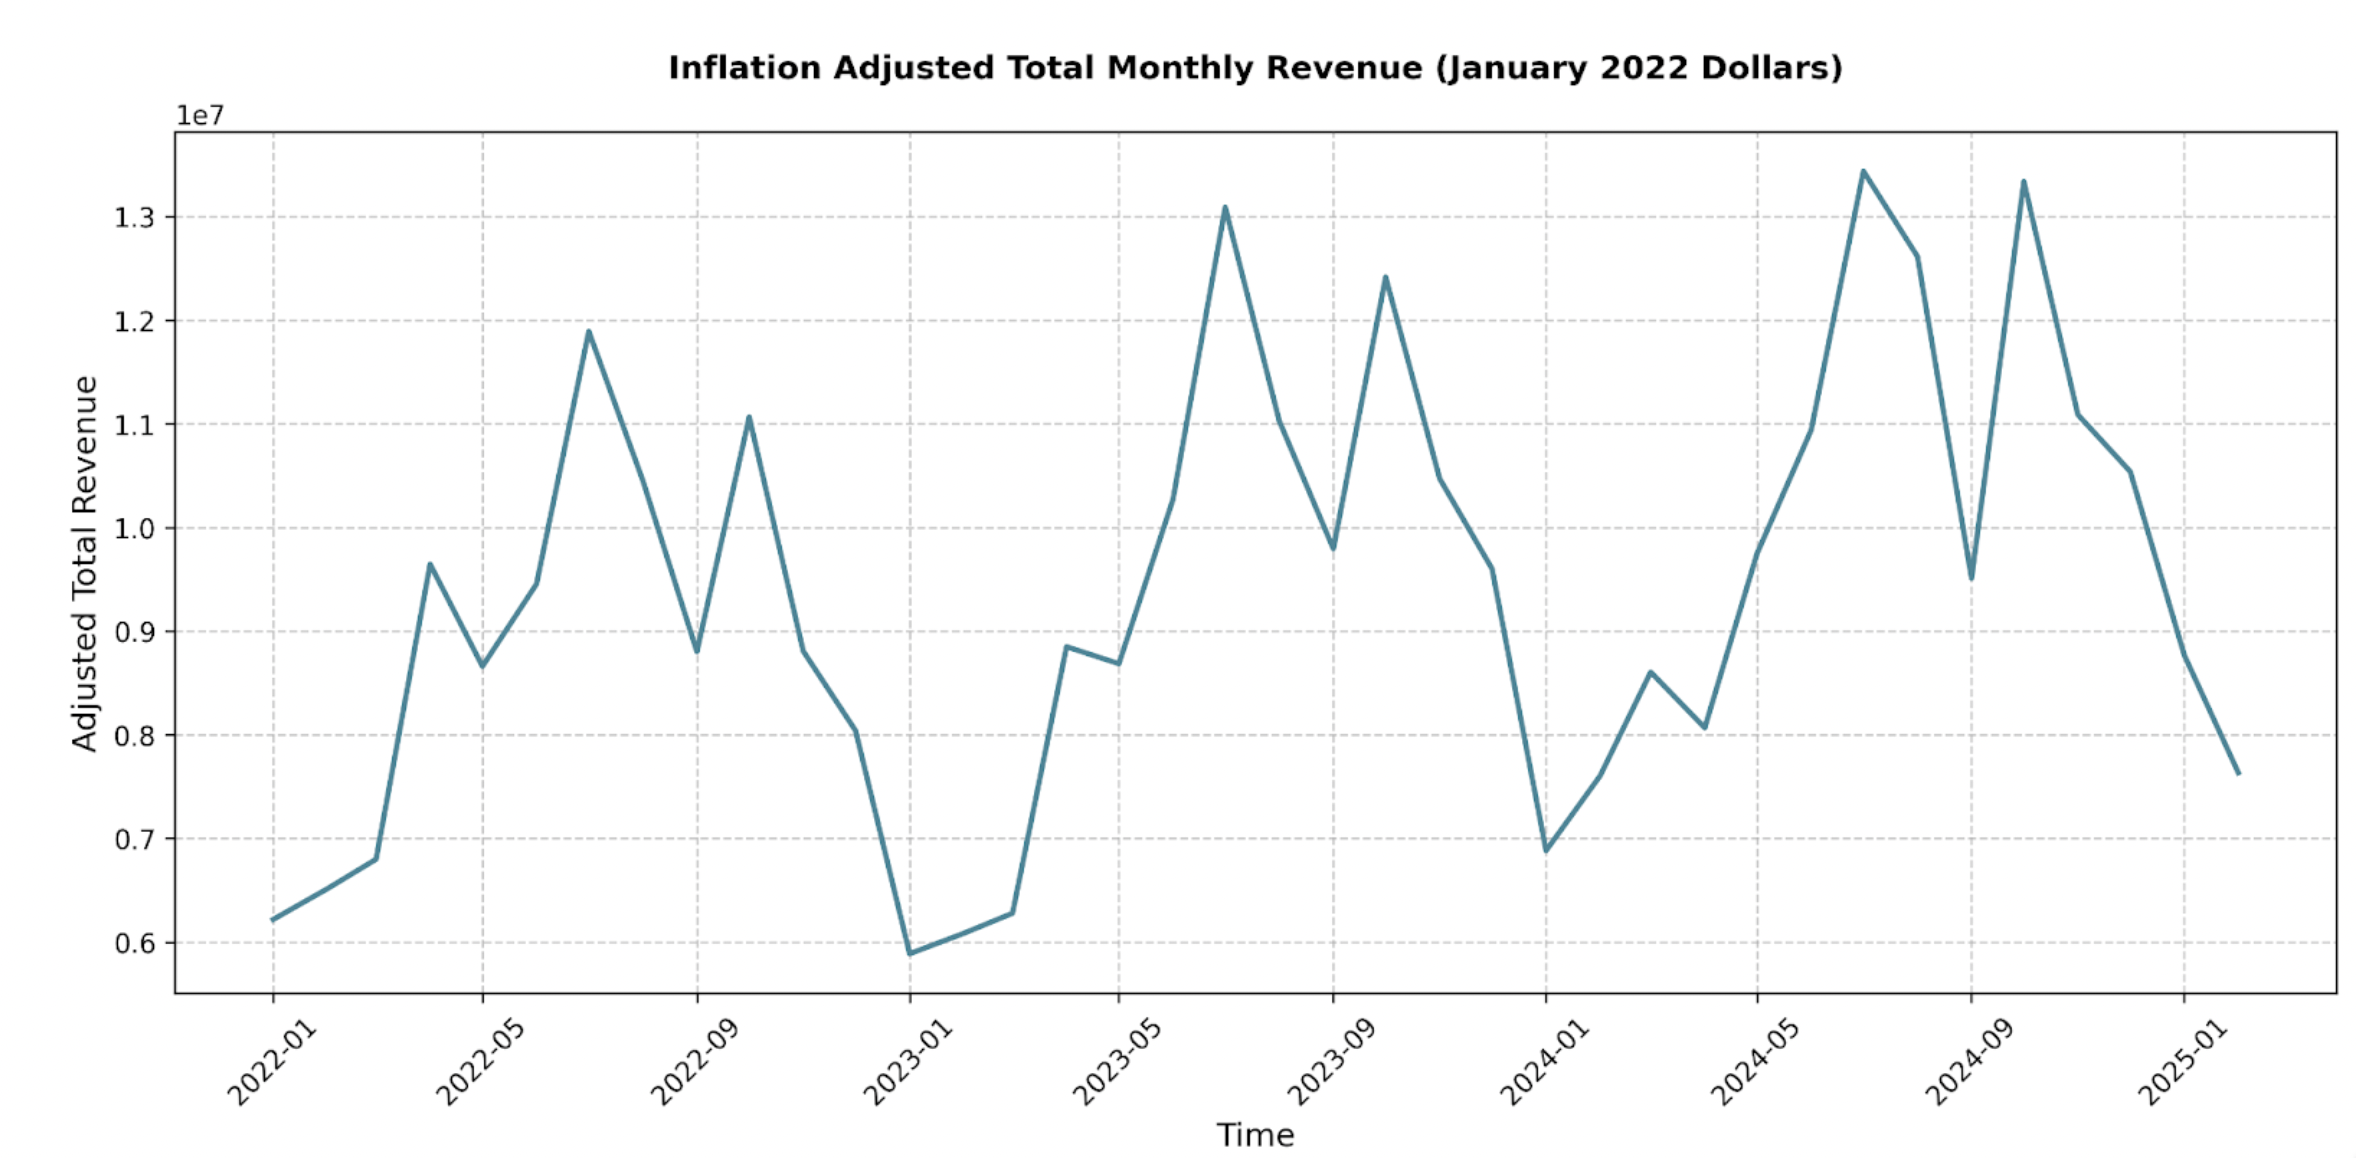
The Shenandoah Valley STR market exhibits strong seasonality and overall growth. Inflation-adjusted total monthly revenue peaks between July and October, exceeding $13 million in 2024. Off-season revenue (January-March) dips below $9 million.
Year-over-year comparisons reveal a dynamic market. While 2023 initially saw some revenue dips compared to 2022, the latter half of the year showed significant growth, with November and December 2023 revenues nearly 20% higher than the same period in 2022. This upward trend continued into 2024, with February and March showing substantial year-over-year increases.
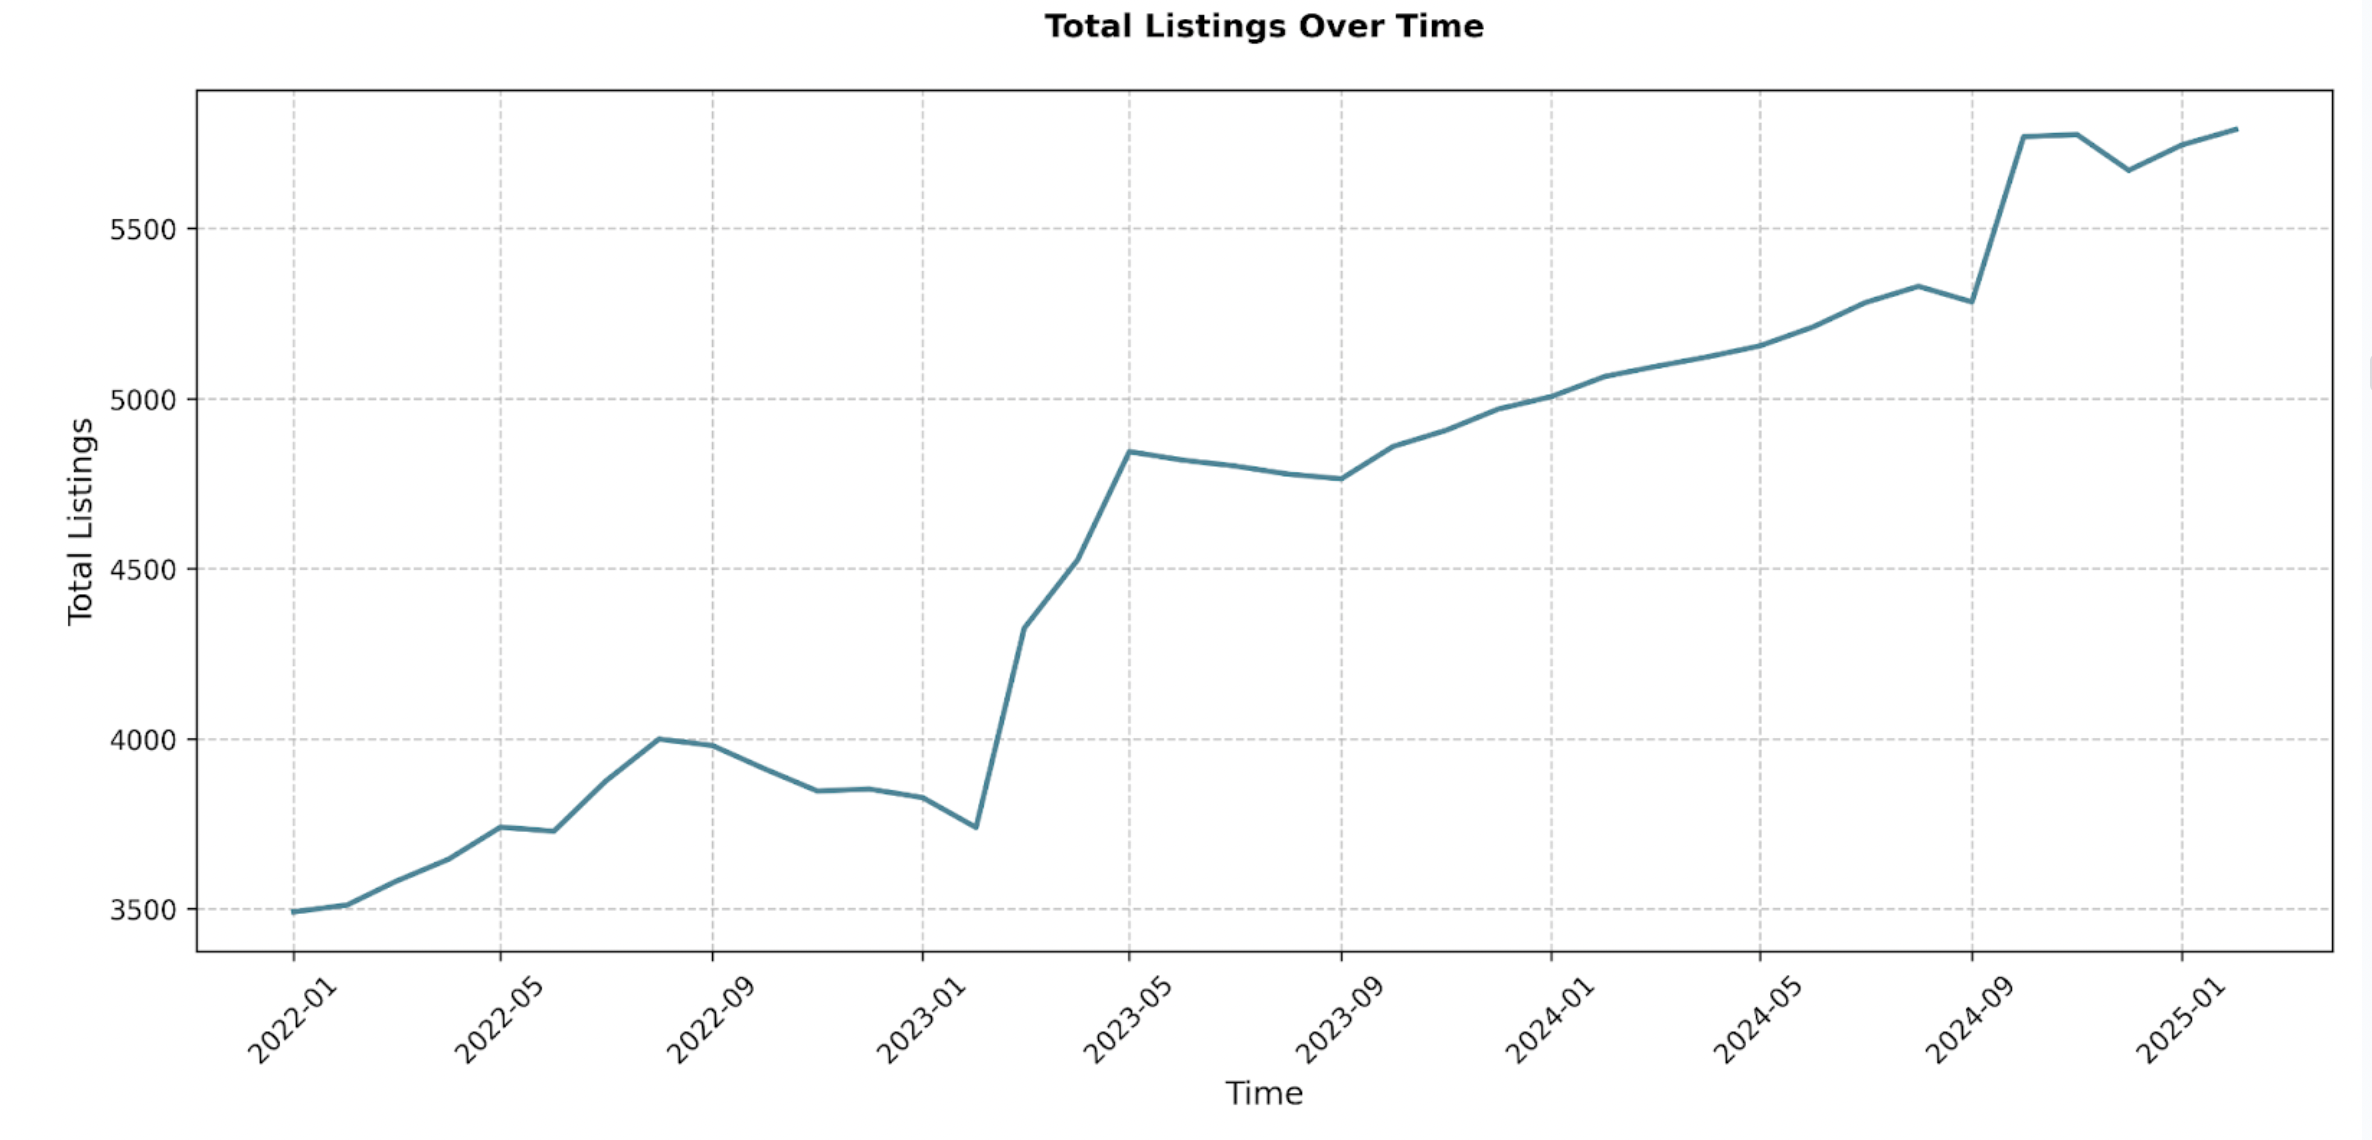
However, the number of STR listings has also steadily increased, rising from approximately 3,491 in January 2022 to 5,791 by February 2025. This growth signals both market confidence and increased competition. Investors should be prepared for seasonal revenue variations and the need to differentiate their properties to attract bookings.
TOP CITIES IN SHENANDOAH VALLEY
Analyzing property counts across the region reveals key areas with established STR activity. The following cities stand out:
- Luray: 678 properties, $32k avg revenue (home of Luray Caverns, gateway to Shenandoah National Park)
- McGaheysville: 655 properties, $38k avg revenue (near Massanutten Resort)
- Basye: 411 properties, $21k avg revenue (near Massanutten Resort)
- Massanutten: 399 properties, $15k avg revenue (within Massanutten Resort)
- Staunton: 271 properties, $13k avg revenue (historic city with a vibrant downtown)
- Harrisonburg: 259 properties, $15k avg revenue (larger city with James Madison University)
- Front Royal: 256 properties, $30k avg revenue (northern entrance to Shenandoah National Park)
These cities’ strategic locations, near major attractions like Shenandoah National Park and Massanutten Resort, contribute to their strong STR presence. It is recommended to consider average daily rates, occupancy rates, seasonality, and the best-performing property types in each location.

WHAT TO BUY

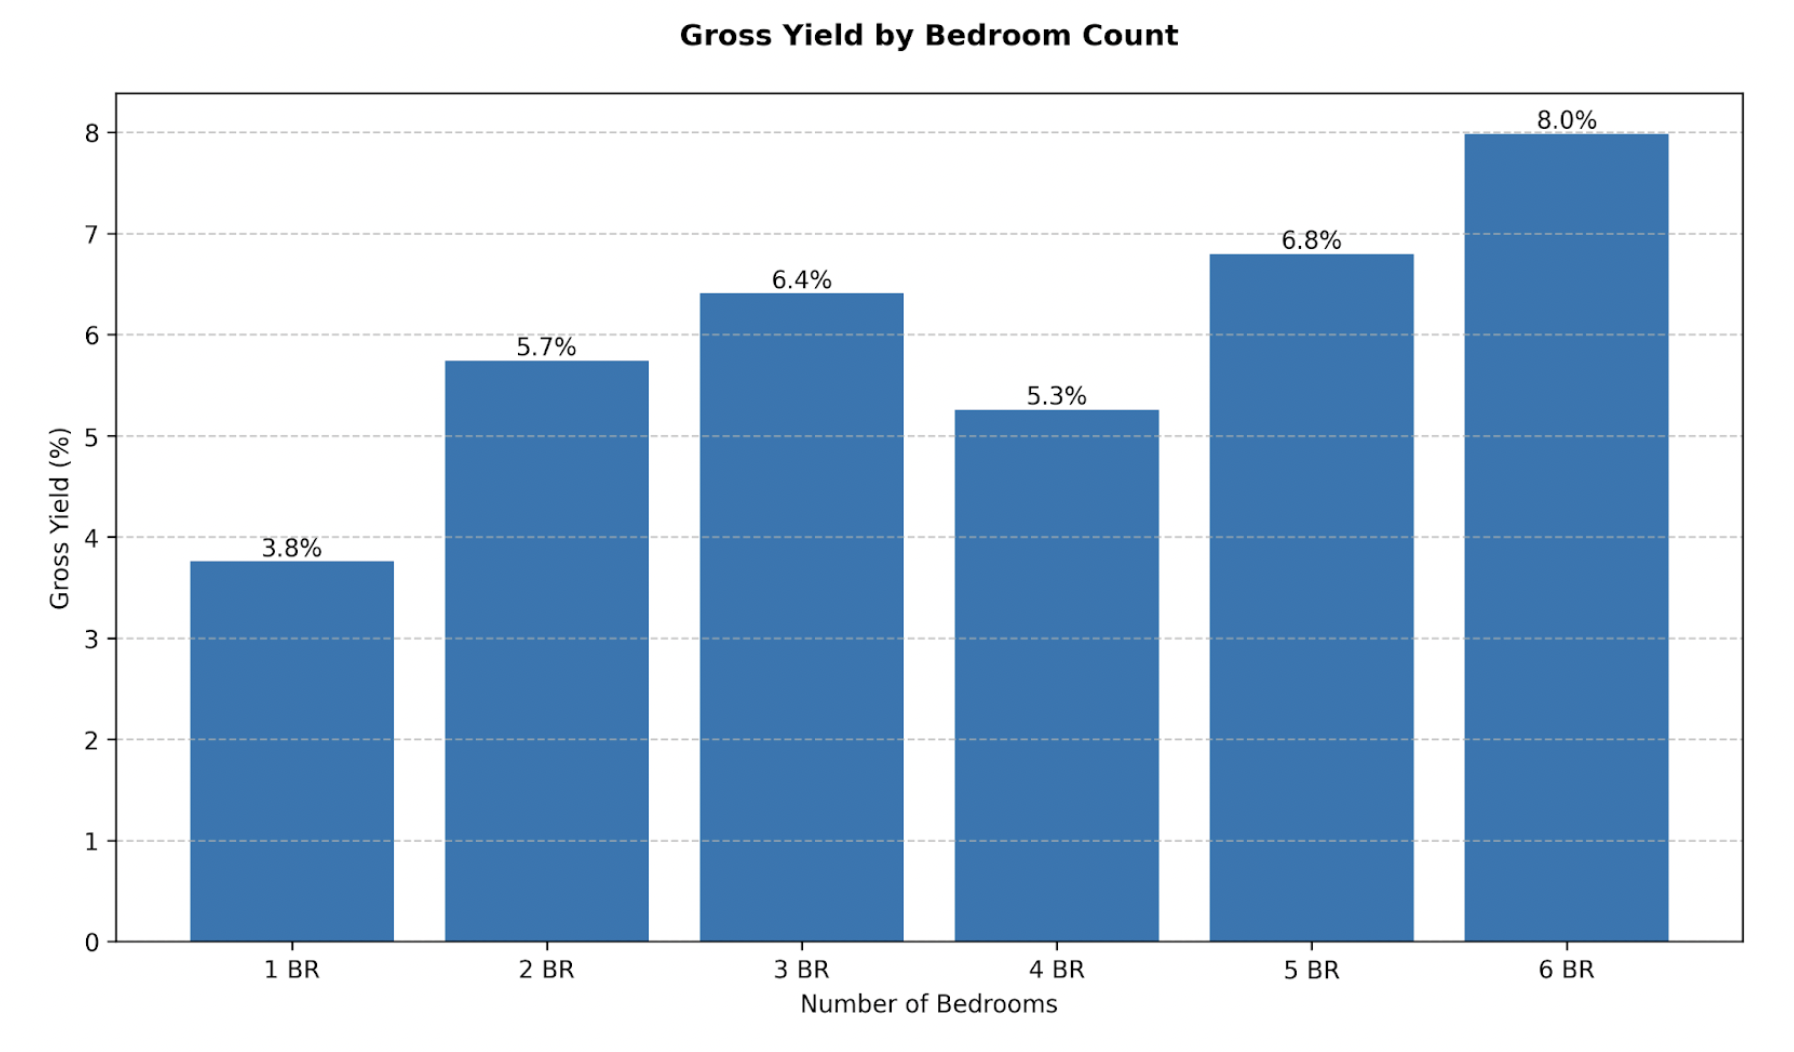
Across the entirety of the region, we analyzed gross yield for different bedroom counts to uncover the best property types. Here is what we found:
- 6-Bedroom Properties: 7.99% gross yield (highest), but only 14 active MLS listings. Limited availability.
- 5-Bedroom Properties: 6.80% gross yield, $48,645 average annual revenue. A strong option, but with only 60 active MLS listings.
- 3-Bedroom Properties: 6.41% gross yield, $28,498 average annual revenue, and 339 active MLS listings. A balance of yield, revenue, and availability.
- 2-Bedroom Properties: 5.74% gross yield, $19,832 average annual revenue, and 64 active MLS listings. A more accessible entry point.
- 4-Bedroom Properties: 5.26% gross yield.
- 1-Bedroom Properties: 3.76% gross yield (lowest), 1465 Airbnb/VRBO listings.
3-bedroom and 5-bedroom properties appear to be the most compelling choices, offering a balance of high yield, robust revenue growth, and reasonable market availability. If you’re looking for a cheaper entry point, 2-bedroom properties present a viable opportunity.
AVERAGE LISTING PERFORMANCE
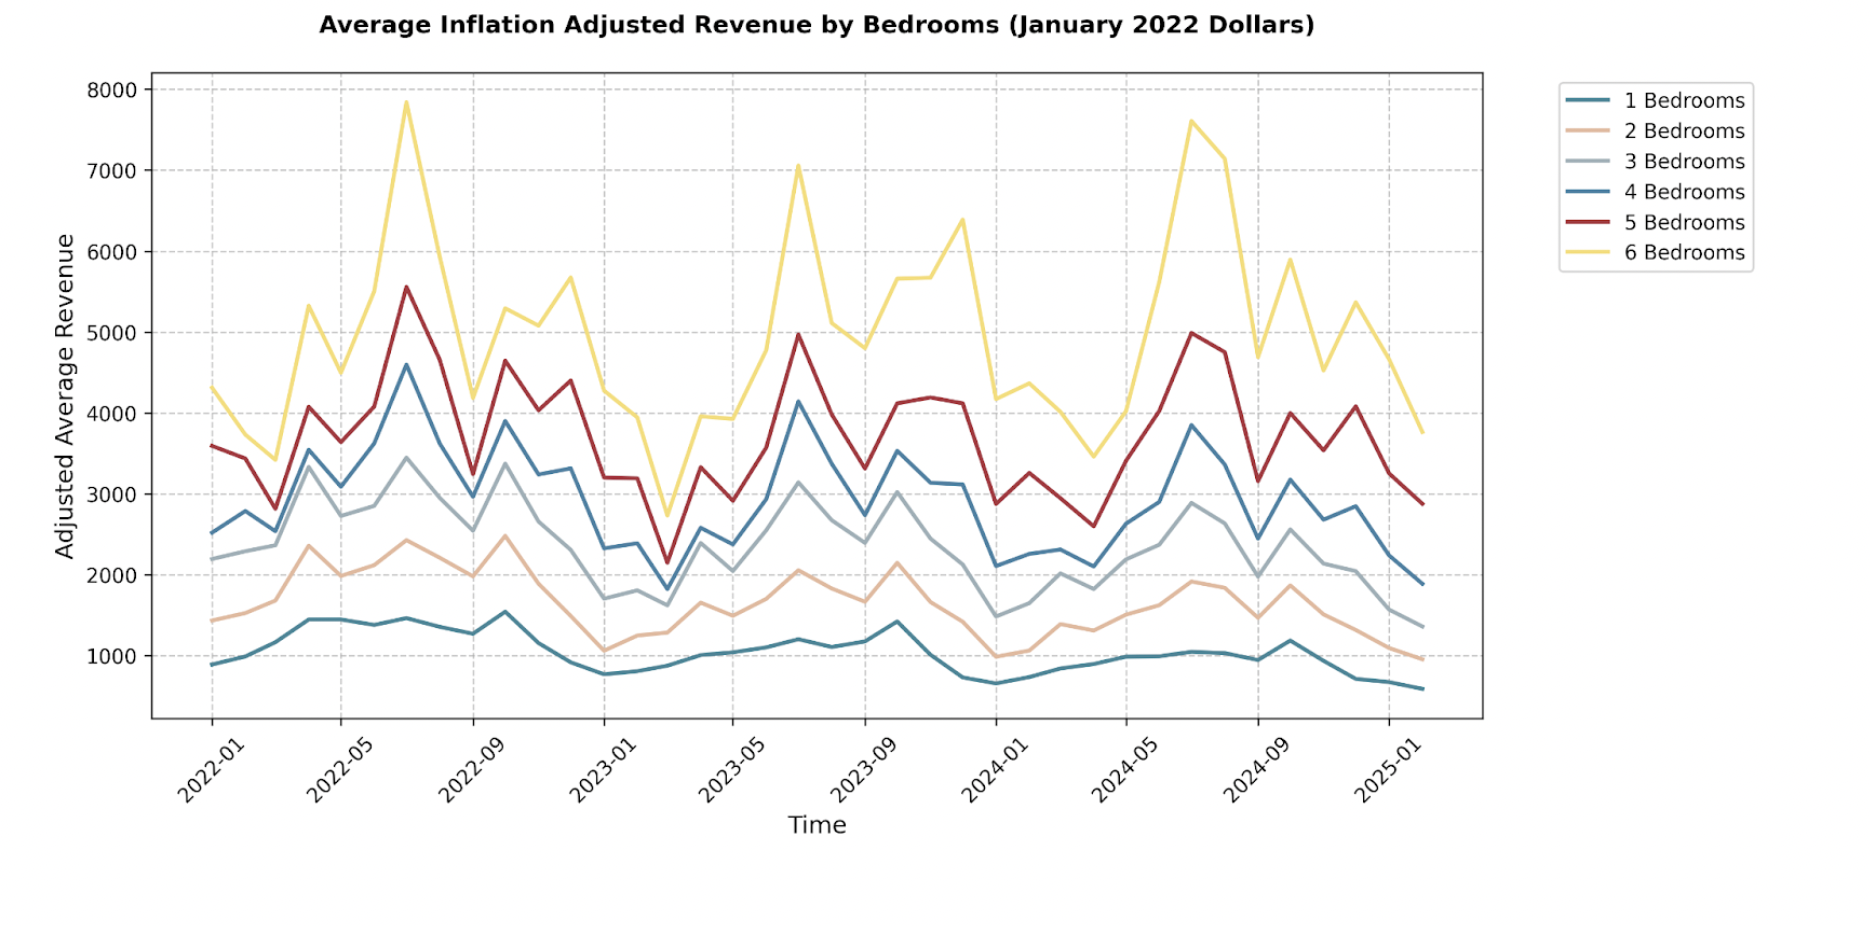
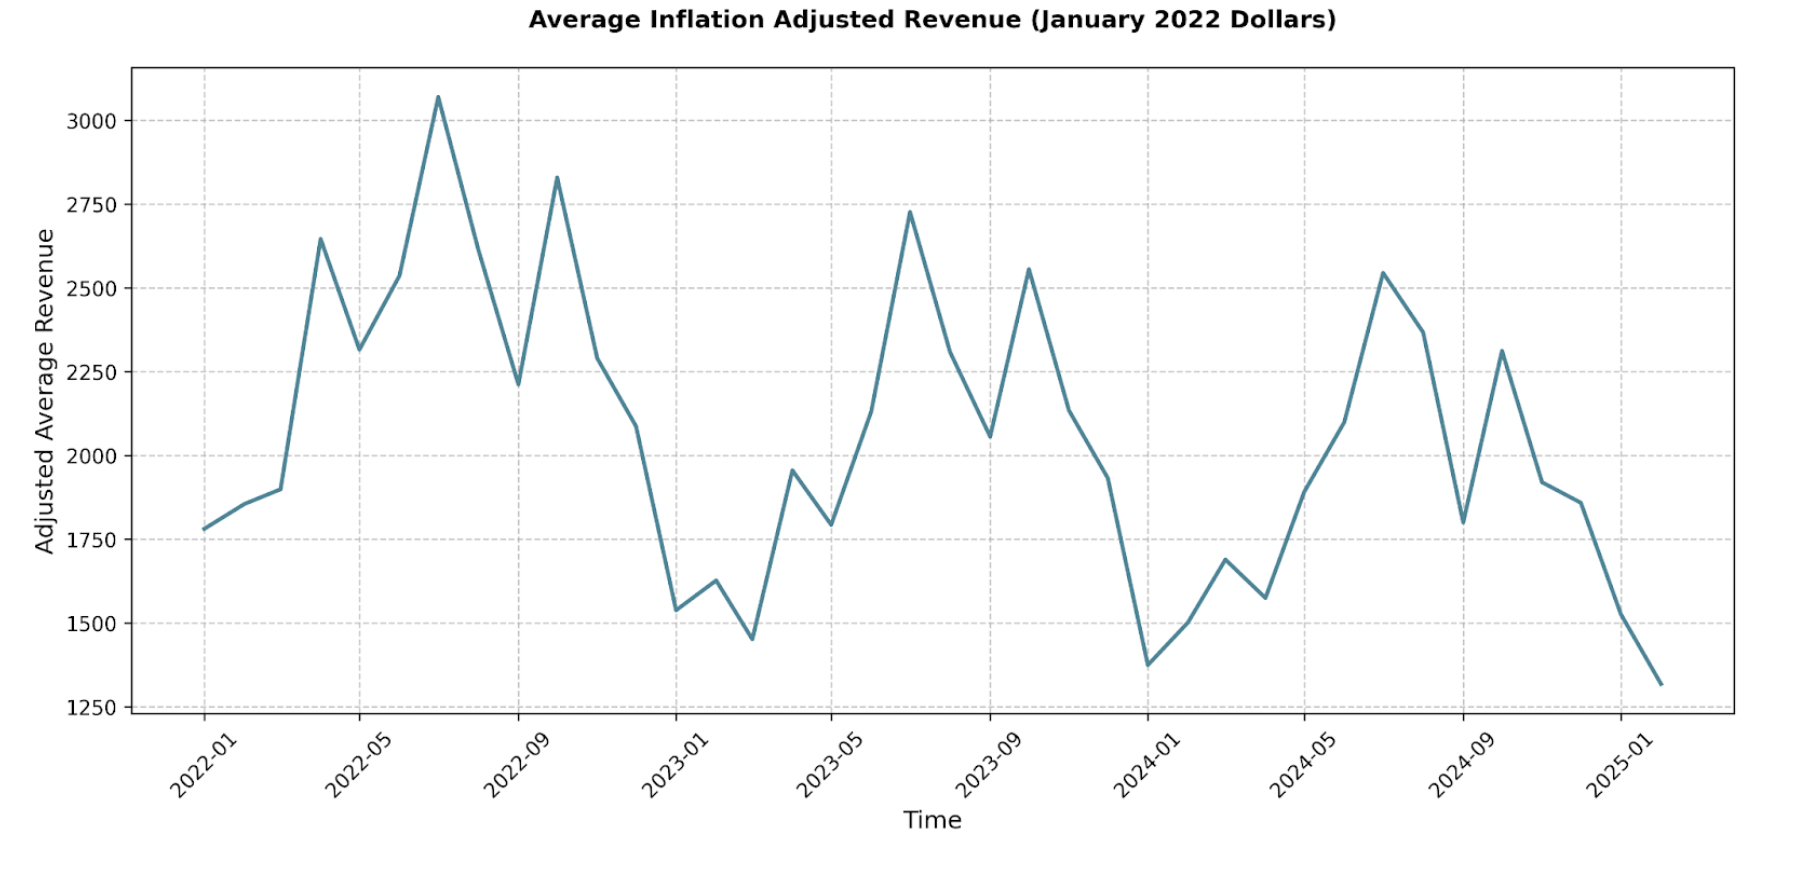
Peak performance occurs from July through October, with average inflation-adjusted monthly revenue between $2,300 and $3,000+. The off-season (January-March) sees revenue dip below $1,700, often reaching lows of $1,300-$1,500.
Year-over-year comparisons show a decline in average monthly revenue, despite overall market growth. For example, the average listing revenue in July decreased from $3,069 in 2022 to $2,544 in 2024. This trend is due to the increased number of listings, spreading the revenue pie thinner, while demand has not kept up.
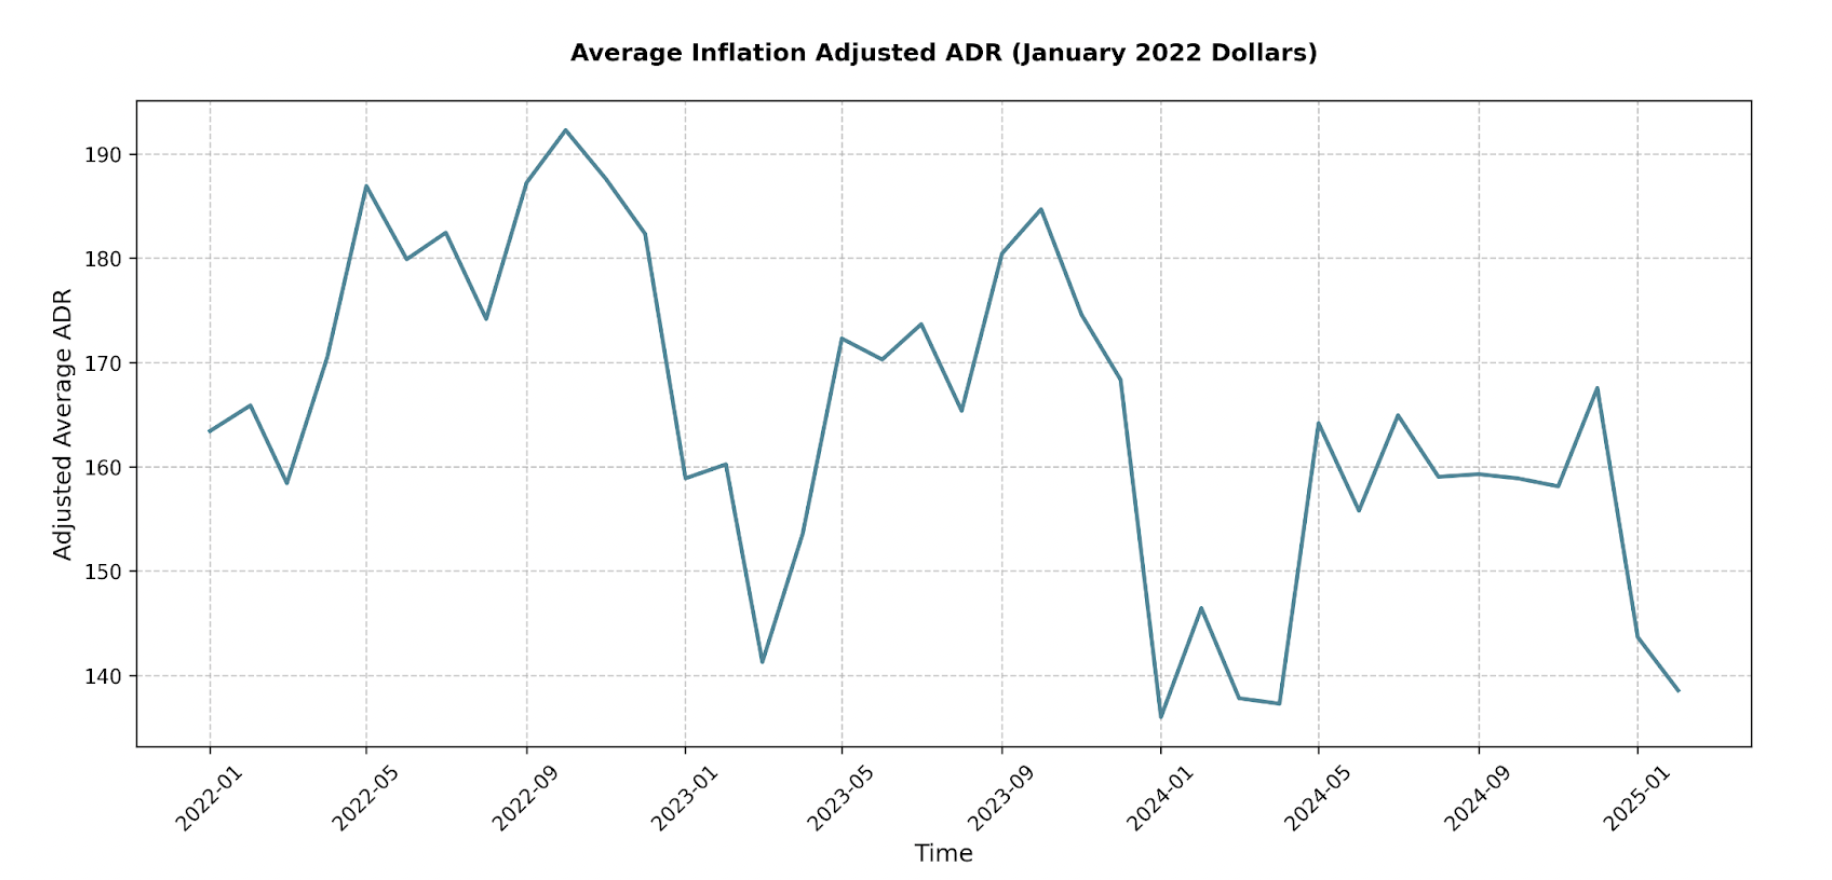
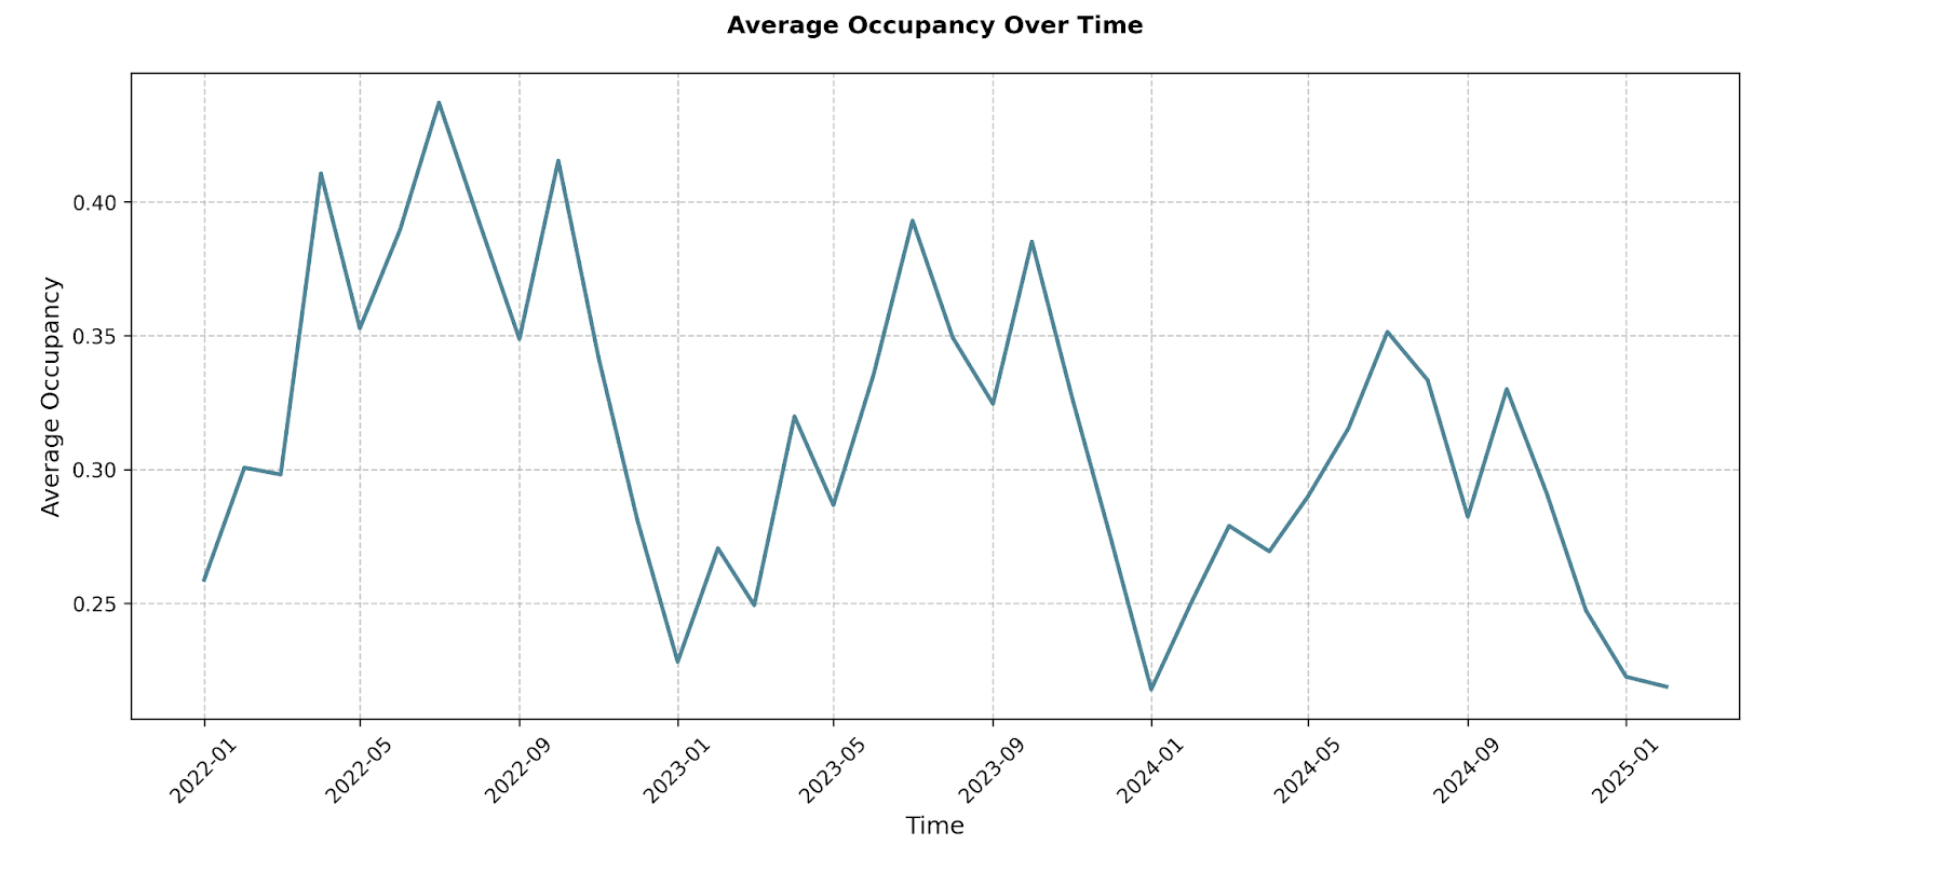
Inflation-adjusted Average Daily Rate (ADR) went from around $192 in October 2022 to $159 in October 2024. Average Occupancy follows a similar pattern, with peak season occupancy rates decreasing year-over-year (e.g., 43.7% in July 2022 to 35.1% in July 2024).
These trends highlight the importance of property differentiation, excellent guest experiences, and smart pricing strategies to stand out in an increasingly competitive market.
AMENITY ANALYSIS
Data reveals that certain amenities significantly impact revenue:
- Hot Tubs: Consistently strong positive impact year-round (e.g., +$1045.60, or 70% increase, in February 2025).
- Pool Tables: Statistically significant positive impact (e.g., +$831.33, or 56% increase, in February 2025). Relatively low market saturation (5.6%).
- EV Chargers: Growing positive impact (e.g., +$683.82, or 46% increase, in February 2025). Very low saturation (4.4%).
Surprisingly, pools and basketball courts show a statistically significant negative impact on revenue in this market. Golf generally doesn’t show a statistically significant impact.
Investors should prioritize hot tubs, pool tables, and EV chargers to maximize ROI.

CONCLUSION
The Shenandoah Valley STR market offers substantial potential, but success requires a strategic, data-driven approach. Thoroughly research local regulations, understand seasonal revenue fluctuations, and recognize the increasing competition. Focus on high-performing property types (3-bedroom and 5-bedroom), and prioritize amenities that demonstrably boost revenue (hot tubs, pool tables, EV chargers).
Continuously monitor market trends, adapt to evolving guest preferences, and focus on delivering exceptional experiences to thrive in this dynamic market. If you’re looking to invest and want the best properties in this area, sign up for Revedy’s HomeMatch today!
Join Revedy's STR Buyer Program!
Talk to a Revedy STR expert and get your portfolio started
Report by Michael Dreger
For more information email inquiry@revedy.com