
The location of a rental property plays a pivotal role in its appeal and profitability. This article delves into the impact of various locations on short-term rental performance, examining the unique characteristics and advantages of six distinct settings: Large City – Urban, Large City – Suburban, Mid-Size City, Small City/Rural, Mountain Leisure and Coastal Leisure. By understanding how each of these environments influence rental dynamics, property owners and prospective investors can make informed decisions to optimize their offerings and maximize returns.
In this comprehensive analysis, we will also explore the distinction between investment-grade and non-investment-grade properties across these locations, shedding light on the characteristics that contribute to STR success. Investment-grade properties, defined as those operating year-round with optimized occupancy and proven operational excellence, serve as benchmarks for aspiring hosts and investors.
By comparing and contrasting these assets, we will uncover valuable insights and trends that can inform decision-making for both seasoned professionals and newcomers.
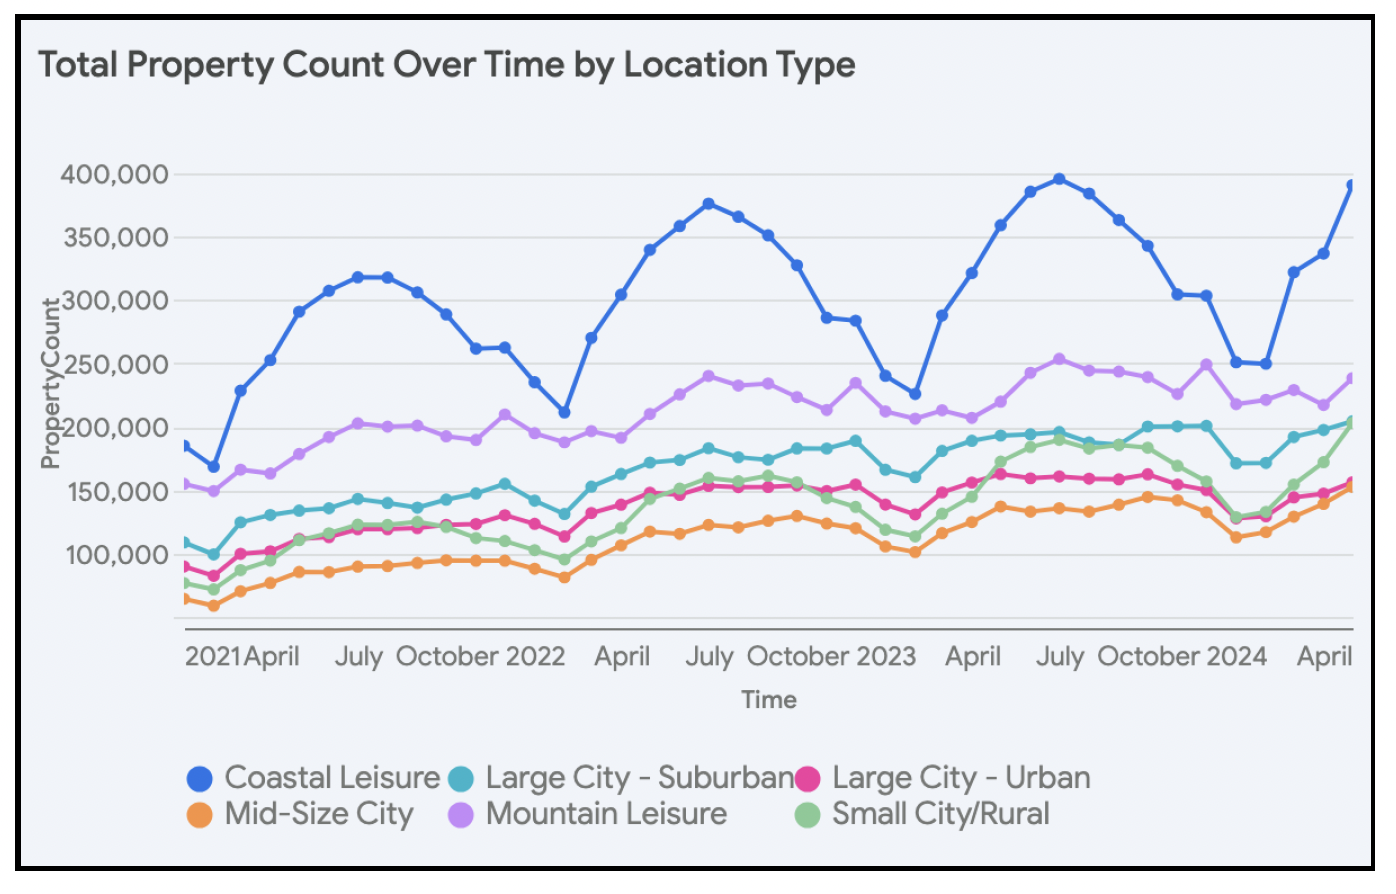
Property Saturation
All location types have experience an increase in property count over time, with some fluctuations. However, the rate of growth and the specific patterns differ between investment-grade and non-investment-grade properties.

Small City/Rural locations have emerged as the frontrunners in overall property count growth, boasting an impressive 83.2% increase. This surge is closely followed by Mid-Size City (78.1%) and Large City – Suburban (52.4%) locations. Notably, the growth in Small City/Rural and Mid-Size City locations has been predominantly fueled by non-investment-grade properties. In contrast, Large City – Suburban locations have witnessed a more balanced growth, with both investment-grade and non-investment-grade properties contributing significantly to the overall increase.
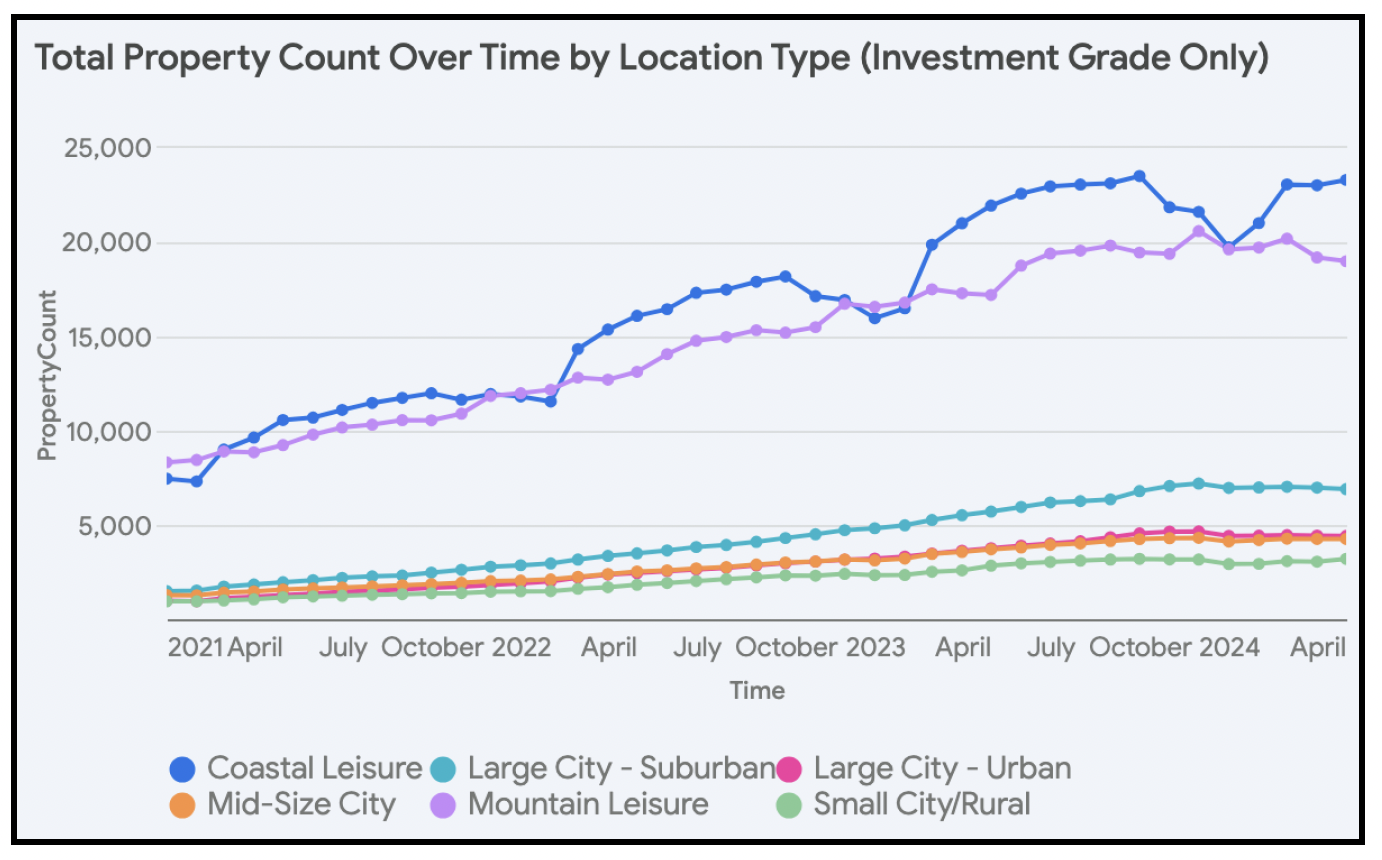
The most substantial growth rates for investment-grade properties have been observed in Large City – Suburban (245.5%) and Large City – Urban (234.3%) locations.
Additionally, while Mountain Leisure locations experienced the lowest overall growth (33.4%), the growth in investment grade properties was much higher (105.1%). In fact, since 2021, every location type has seen investment-grade properties grow by over 100%, but the highest growth rate for non-investment-grade properties was just 82.3%, observed in Small City/Rural locations.
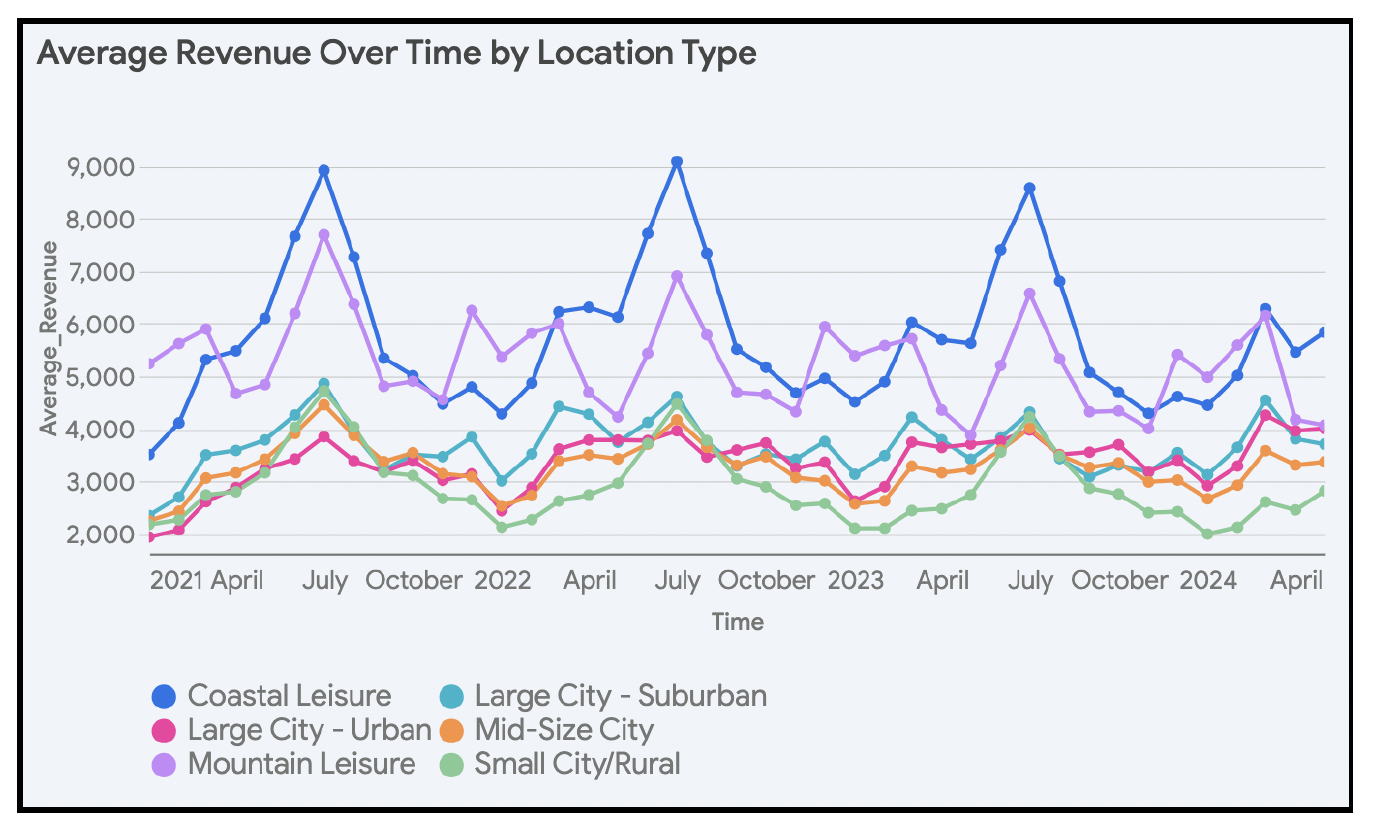
Revenue Growth
Overall, average monthly revenue for all properties has increased in Mountain Leisure, Large City – Urban, and Coastal Leisure locations, while it has decreased slightly in Small City/Rural, Mid-Size City, and Large City – Suburban locations.
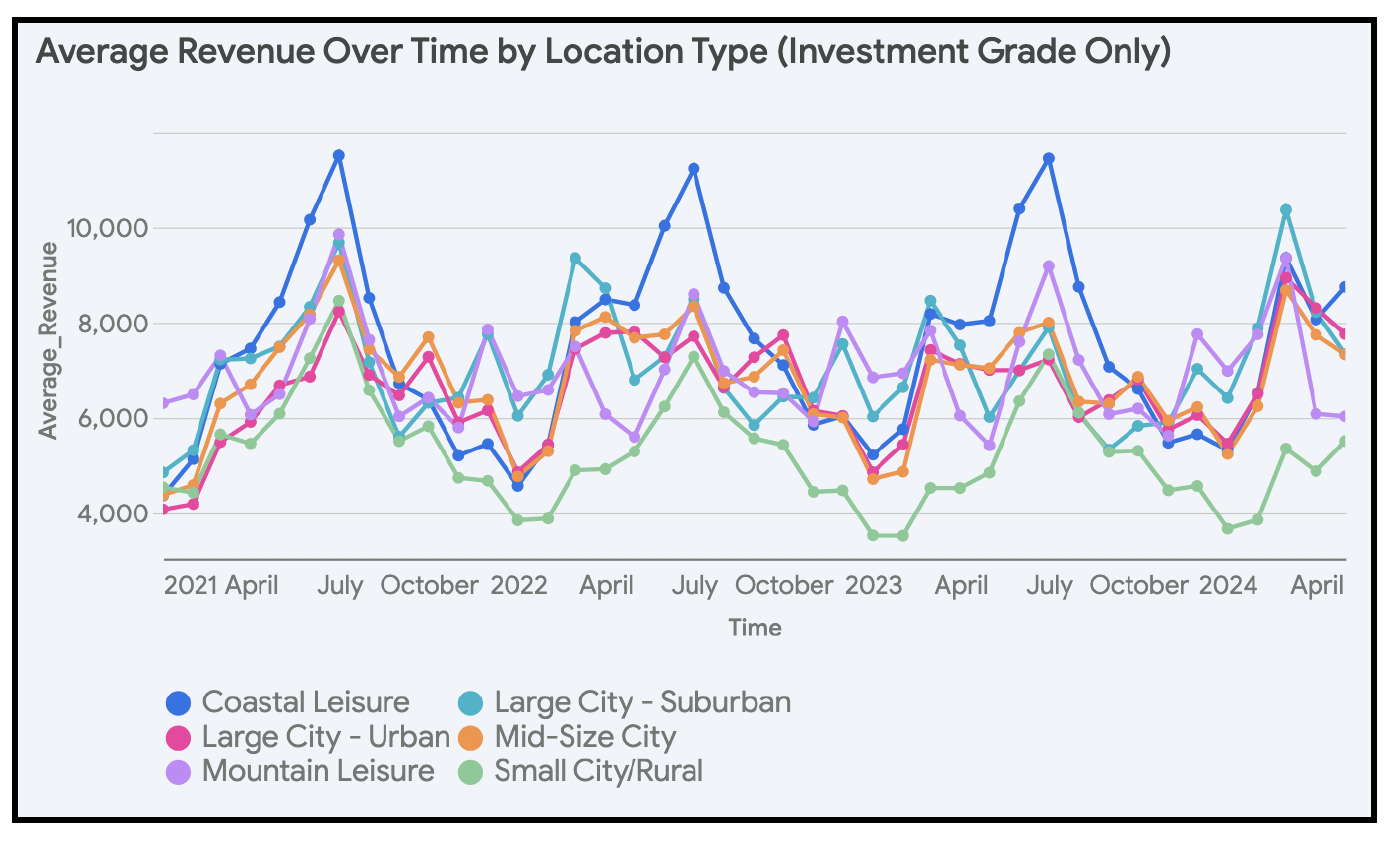
For investment-grade properties specifically, average monthly revenue increased in Large City – Urban and Coastal Leisure locations, and has decreased slightly everywhere else. Large City – Urban experienced the highest increase in revenue, rising from $6679 in May 2021 to $7754 in May 2024.
Impact of Location on Hot Tubs and Pool Tables
To evaluate the preference for hot tubs and pool tables by location, we will focus on investment-grade assets. By analyzing investment-grade properties, we will gain insights into the strategies employed by successful hosts and investors to maximize guest satisfaction and revenue generation.
Both hot tubs and pool tables experienced substantial growth from 2021 to 2024, albeit at varying rates depending on the location. Hot tubs saw the most remarkable growth in ‘Large City – Urban’ areas, with a staggering 377% increase in property count. ‘Mid-Size City’ locations also witnessed a considerable 152% rise in hot tub properties. Similarly, pool tables experienced the highest growth in ‘Large City – Urban’ areas, boasting a 597% increase, followed by ‘Mid-Size City’ with a 211% increase.
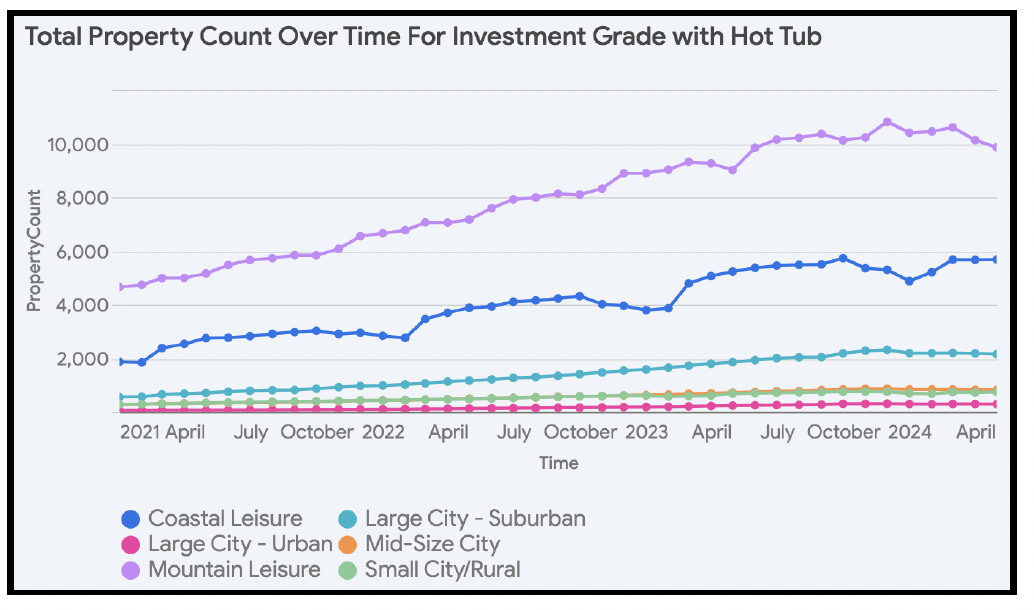
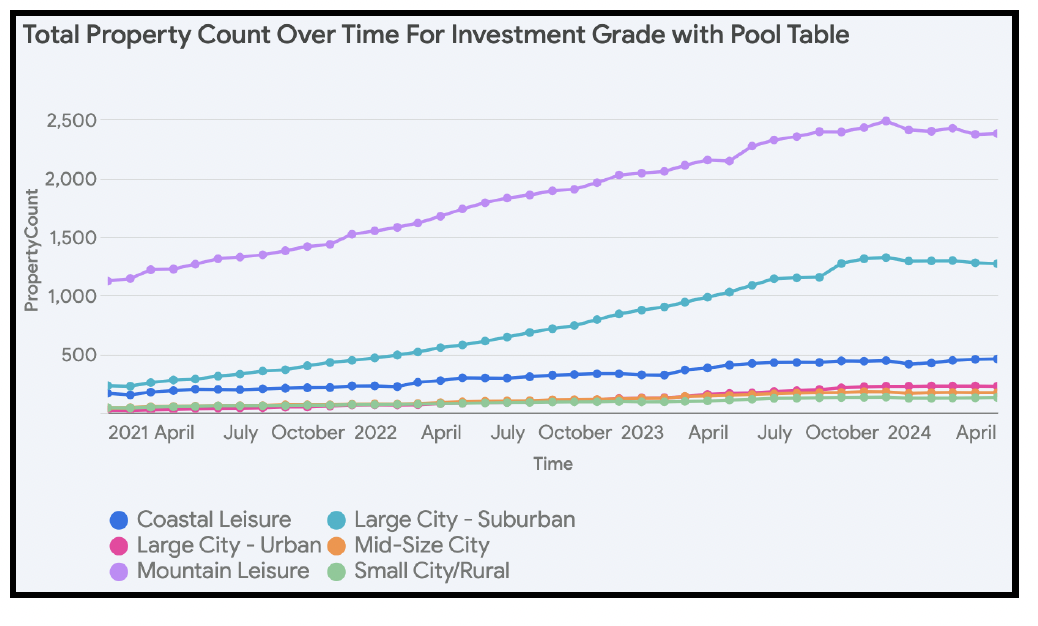
There are distinct preferences for hot tubs and pool tables in different locations. Notably, Hot tubs are predominantly found in ‘Mountain Leisure’ and ‘Coastal Leisure’ areas. Pool tables are most prevalent in ‘Large City – Suburban’ and ‘Mountain Leisure’ locations.
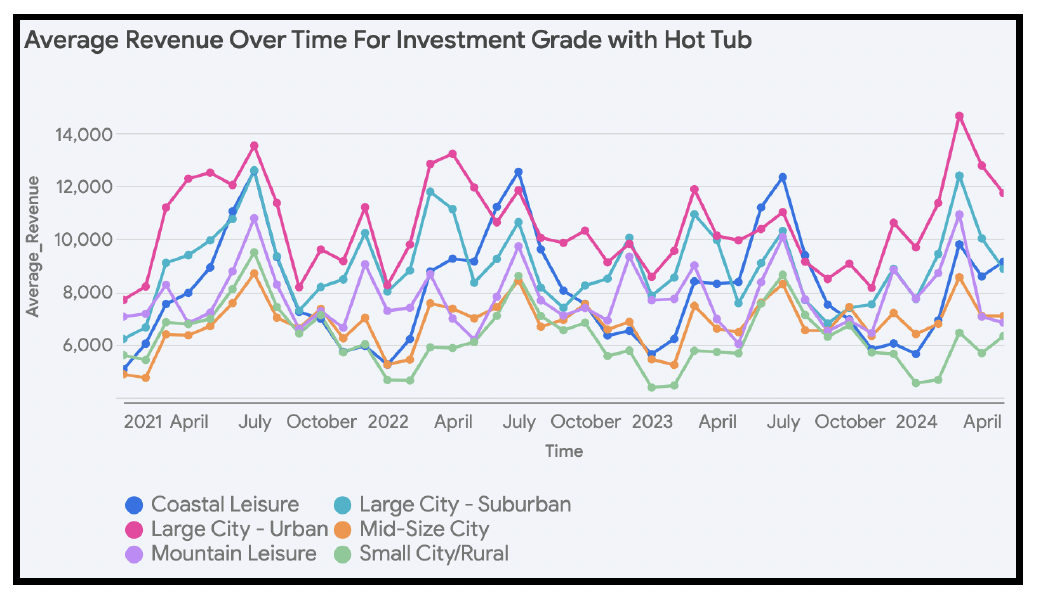
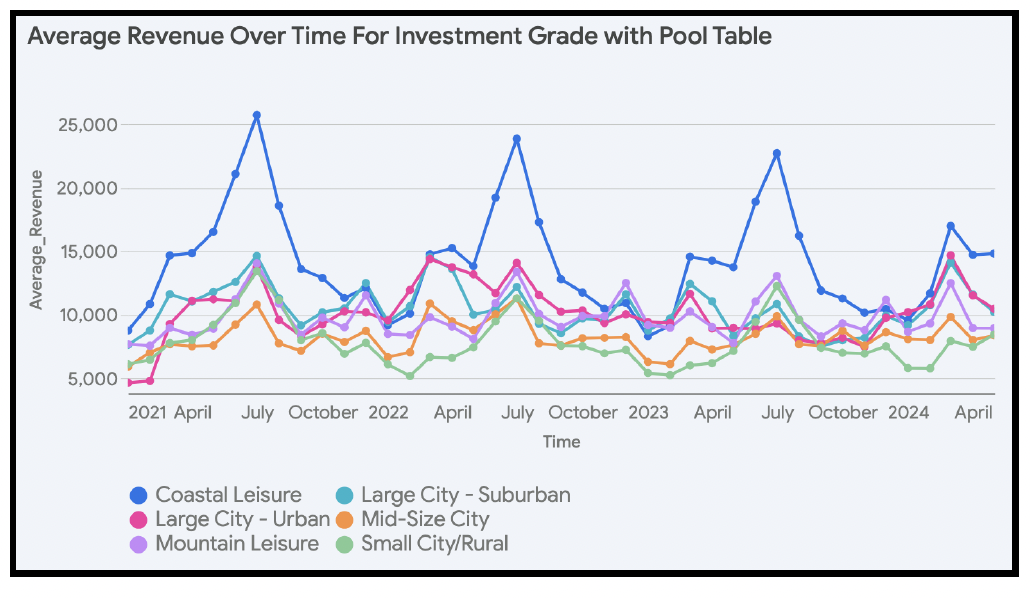
The changes in average monthly revenue for both of these amenities from 2021 to 2024 were mixed. Notably, hot tubs saw the most significant revenue decrease in ‘Small City/Rural’ locations (-9.4%), while pool tables experienced the largest decline in ‘Coastal Leisure’ locations (-10.3%). Revenue for STRs with hot tubs increased in ‘Mid-Size City’ (5.7%) and ‘Coastal Leisure’ (2.6%) locations. For properties with pool tables, revenue increased in ‘Mid-Size City’ (10.4%) and ‘Mountain Leisure’ (0.6%) locations.
Conclusion
The short-term rental (STR) landscape is becoming increasingly intricate. Success in this industry hinges on a deep understanding of the unique dynamics of each location, the specific attributes of properties, and the ever-changing preferences of guests. As this analysis reveals, each location type presents distinct opportunities and challenges that require careful consideration.
The data underscores the importance of strategic decision-making for property owners and investors. Whether it’s optimizing amenities to align with location-specific demands, adapting pricing strategies to seasonal trends, or capitalizing on emerging markets, success in the STR market requires a data-driven approach. As the industry continues to evolve, staying ahead of the curve will necessitate ongoing analysis and a commitment to delivering exceptional guest experiences tailored to the distinct characteristics of each location.
Let us Help You Start Your STR Portfolio!
Discover the benefits of data-driven design.
Report by Michael Dreger
For more information email inquiry@revedy.com