
The Blue Ridge, GA short-term rental (STR) market has experienced notable changes in recent years. This article delves into this evolving landscape, examining factors such as property saturation, revenue performance, and the influence of amenities. The analysis will provide valuable insights on both investment-grade* and non-investment-grade assets for current and prospective investors.
*Investment-grade assets are defined as STRs operating year-round, being well-managed (e.g. optimized occupancy) and proven operational excellence (e.g. great reviews).
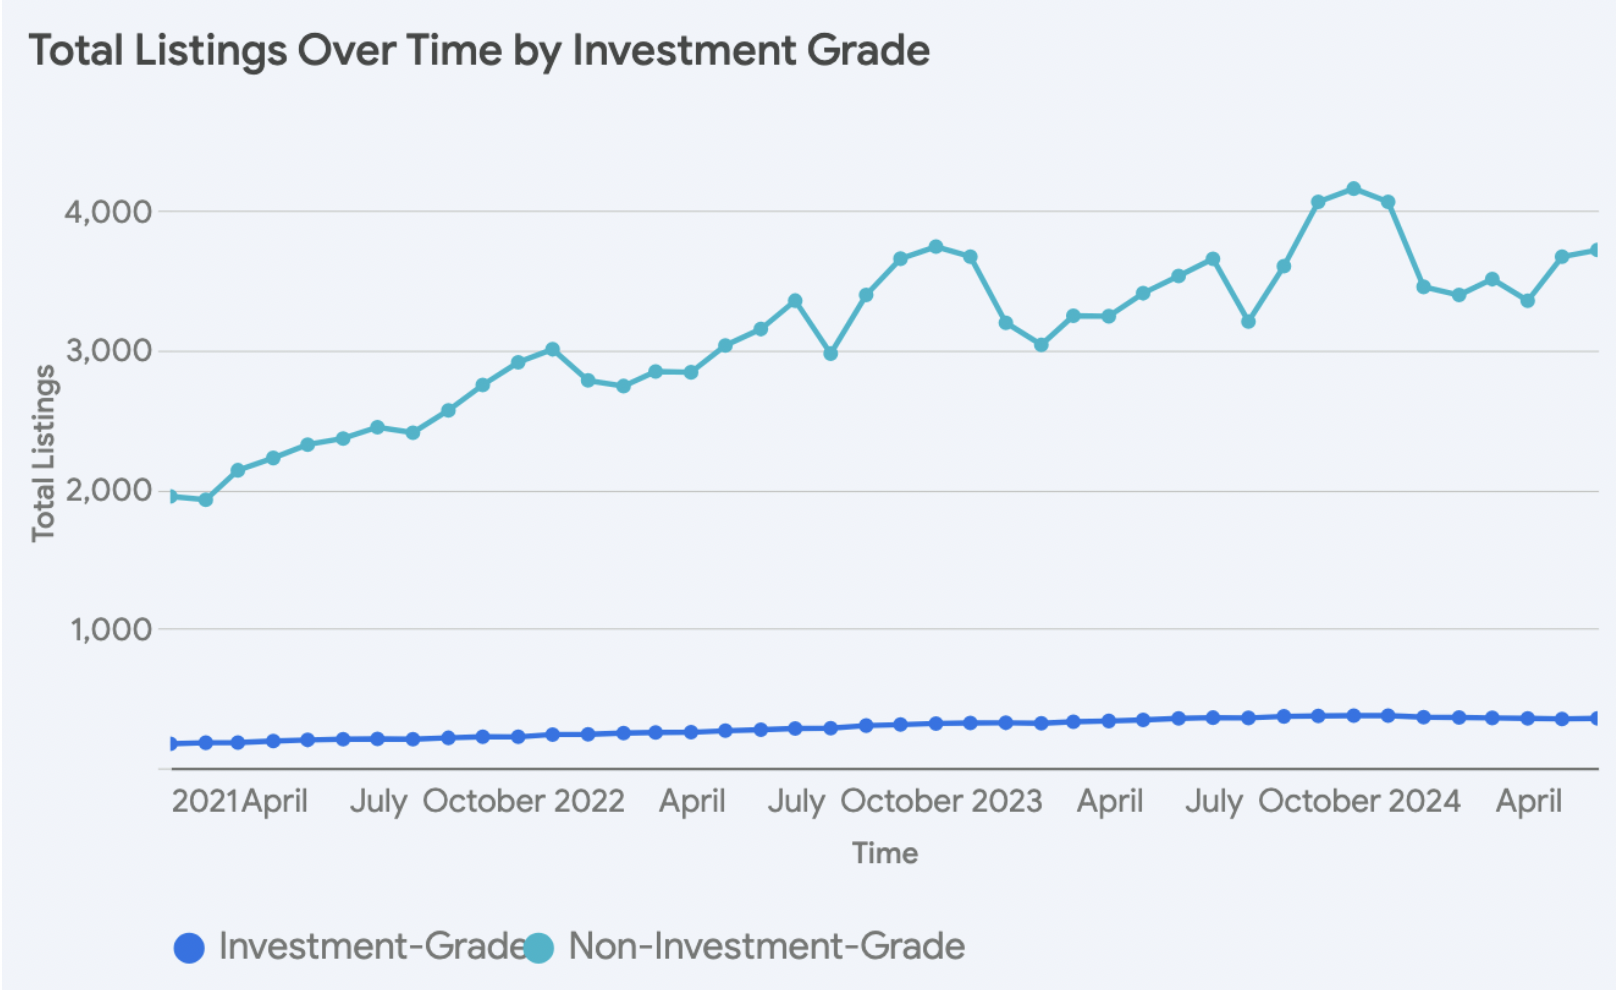
Property Saturation Overview
In the earlier part of the observed period, specifically from January 2021 to around mid-2022, both investment-grade and non-investment-grade asset classes displayed a steady increase in the number of listings. However, a clear turning point emerged around mid-2022. While non-investment-grade properties continued their upward trajectory, albeit at a slightly moderated pace, investment-grade listings plateaued.
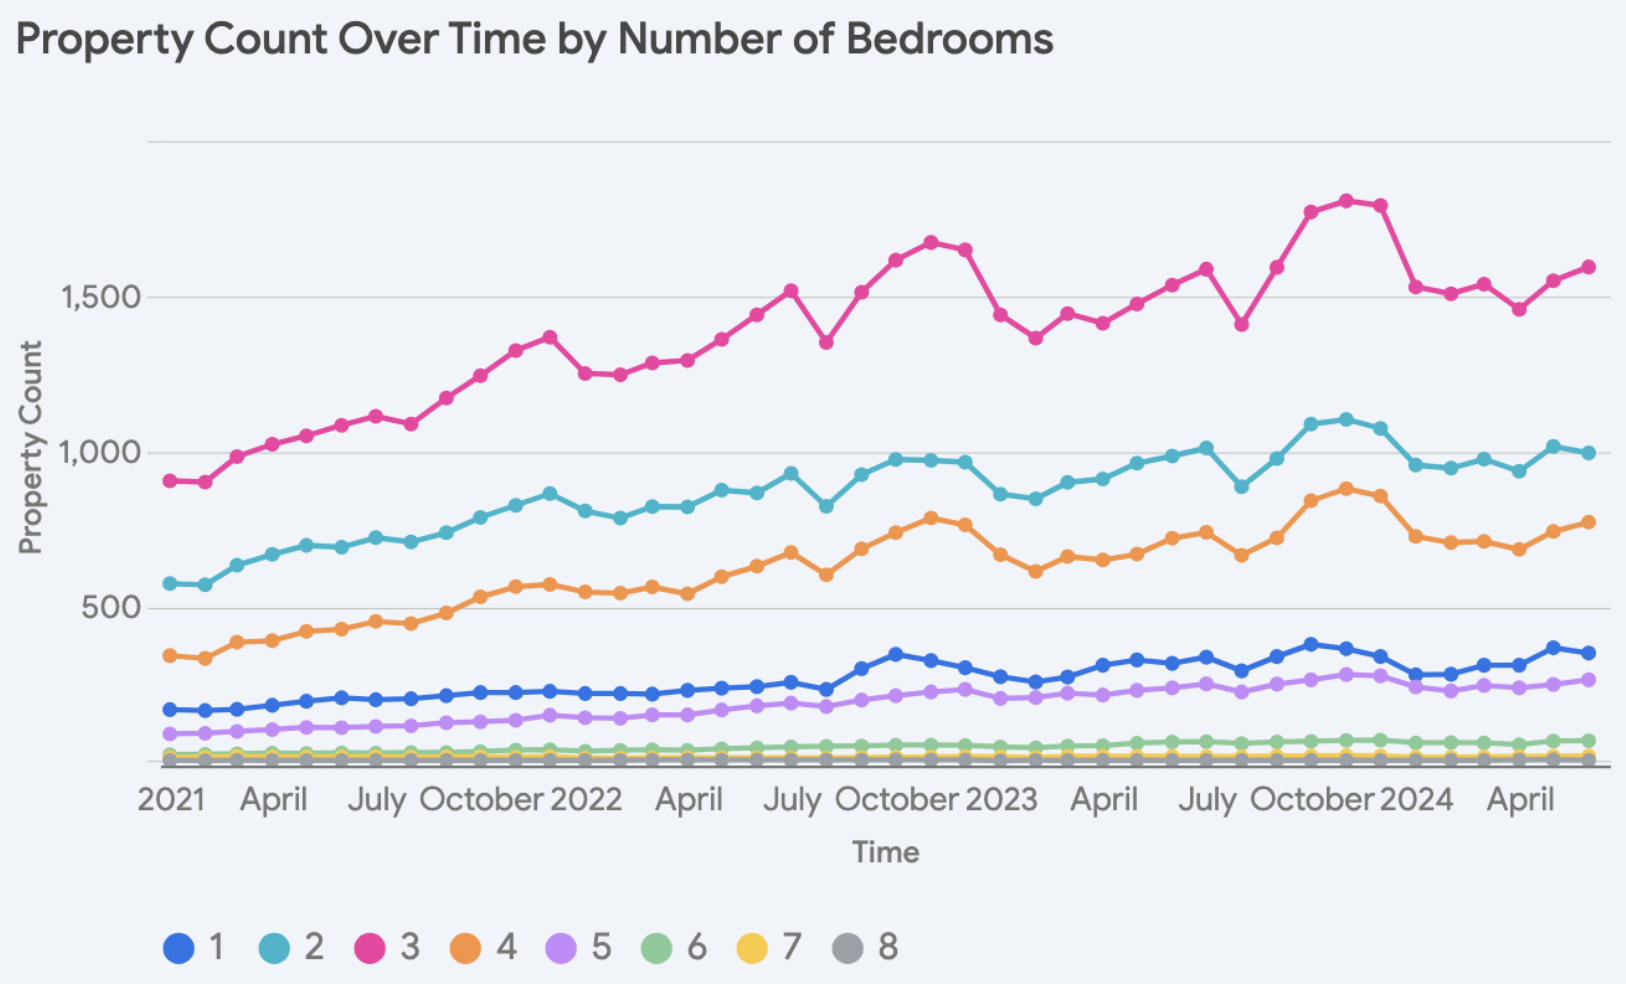
Delving deeper into the dynamics of the Blue Ridge STR market, an analysis of property counts based on the number of bedrooms reveals further insights. The most striking trend is the dominance of 3-bedroom properties, which consistently account for the largest share of listings throughout the observed period.
Additionally, there’s a noticeable increase in the listings of larger properties, particularly those with 4 or 5 bedrooms. This indicates a growing demand for accommodations suitable for larger groups or families.
Revenue Analysis
From early 2021 to mid-2022, both investment-grade and non-investment-grade assets observed steady performance, with investment-grade properties commanding a significant premium. This premium peaked in July 2021, with investment-grade properties earning an average revenue of $9,369 compared to $7,288 for non-investment-grade properties, a difference of about 29%.
However, since 2021, there has been no increase in average monthly revenue performance. By June 2024, the average revenue for investment-grade properties had dropped to $5,793, while non-investment-grade properties were at $4,254.
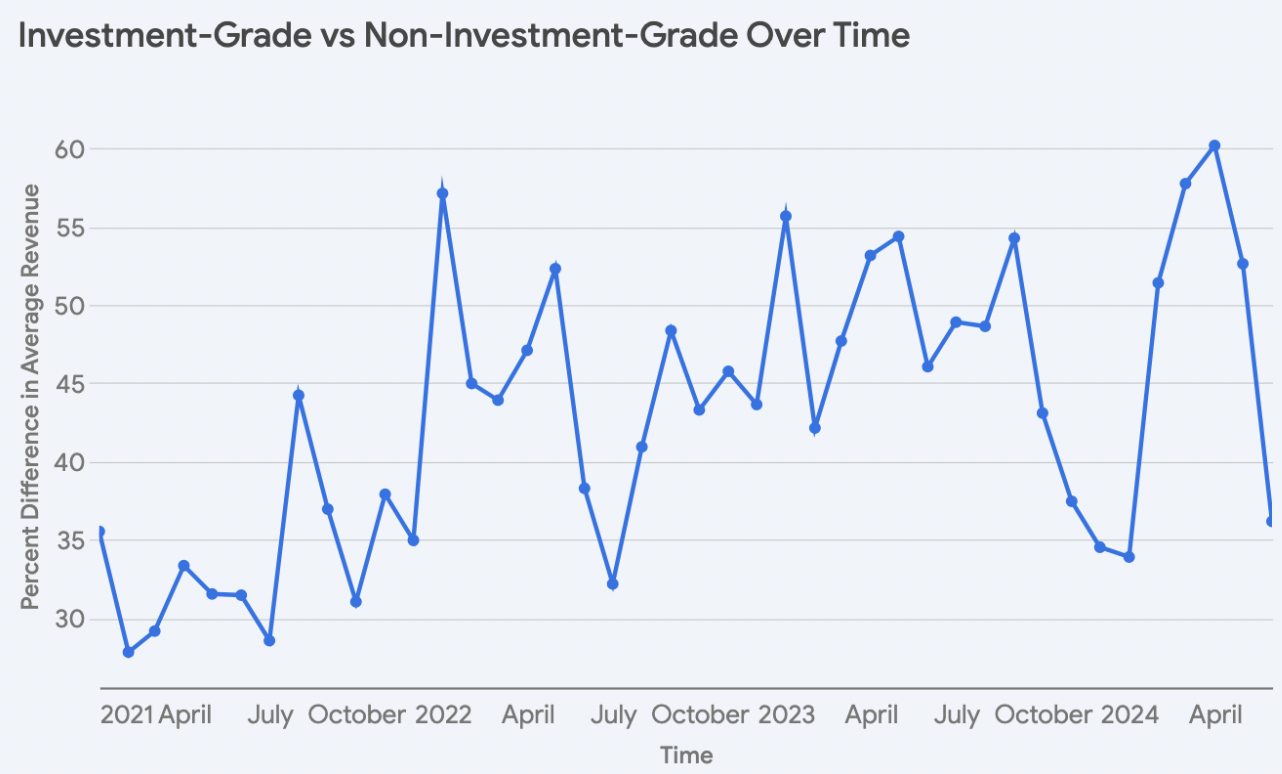
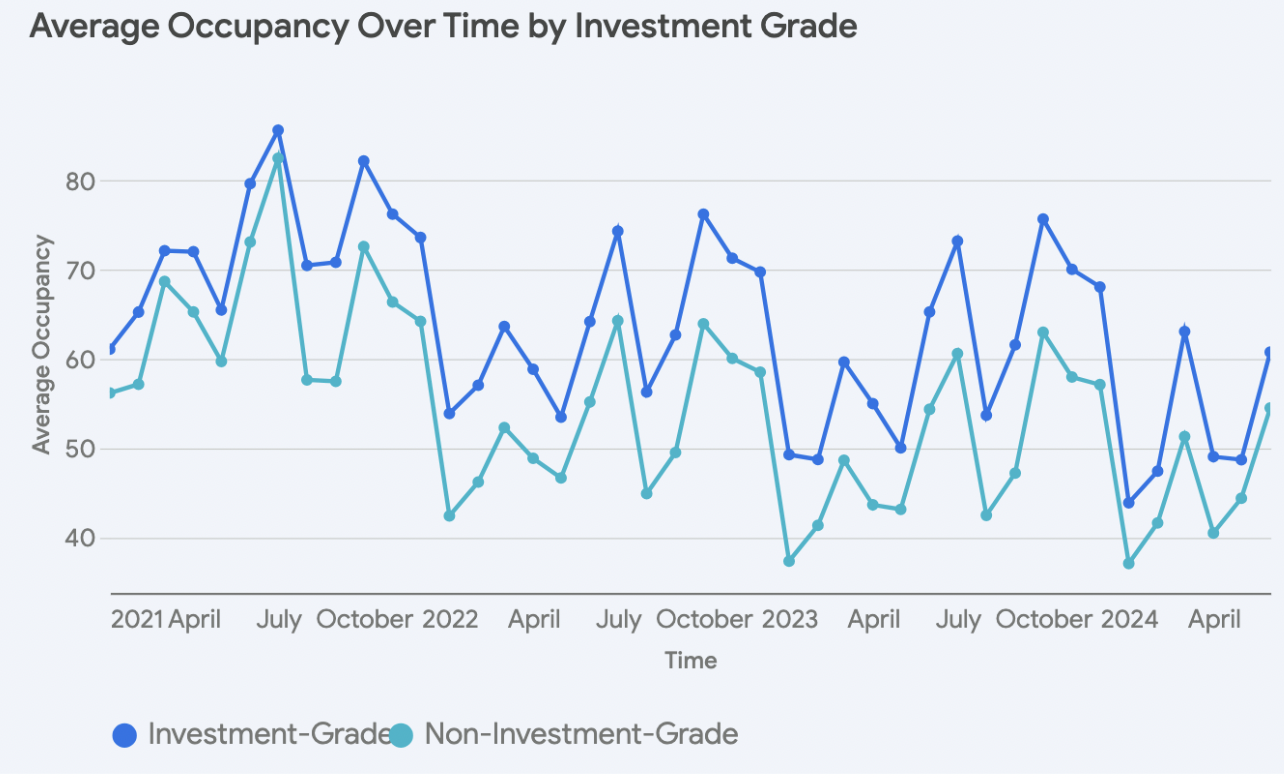
Despite this, the percentage difference between investment-grade and non-investment-grade assets has increased. This difference in June 2021 was only 33% compared to April 2024, where this difference was observed at 60%. Investment-grade assets achieve this due to both higher average daily rate (ADR) and occupancy. In April 2024, investment-grade assets had 12% higher ADR, and 23% higher occupancy.

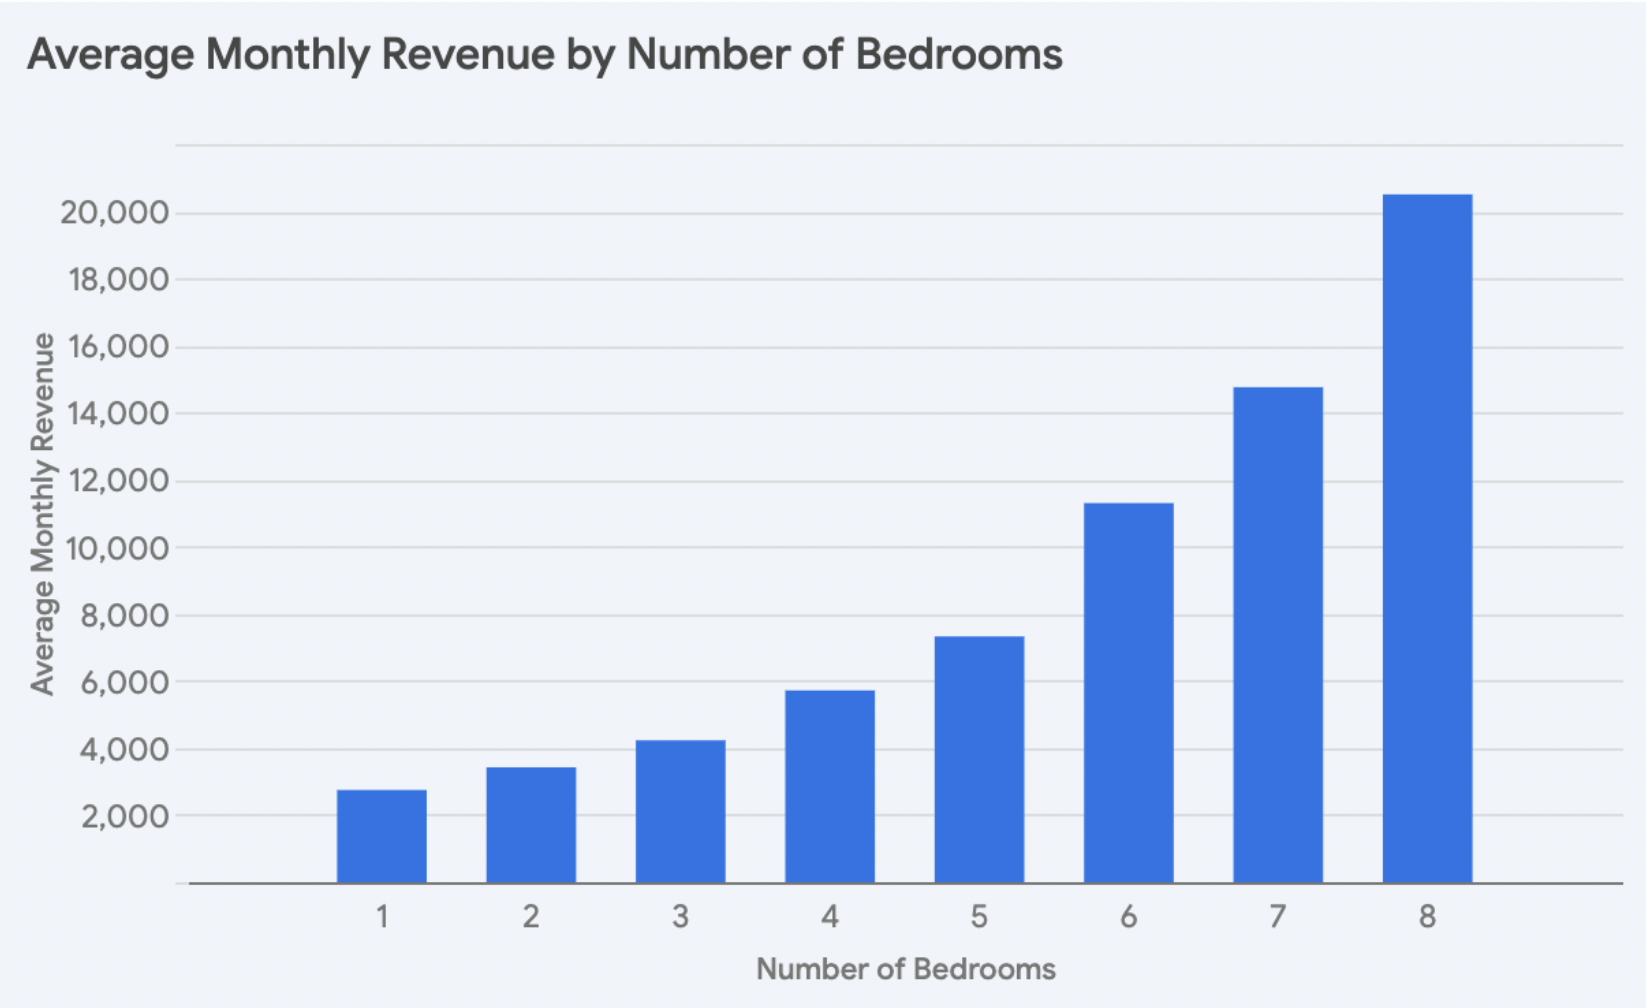

Regarding property attributes, the number of bedrooms is positively correlated with average monthly revenue. This trend is particularly pronounced for properties with 6 or more bedrooms which cater to large groups or luxury travelers. Regression analysis quantifies this relationship, indicating that each additional bedroom contributes to an increase of approximately $1,545 in average monthly revenue.
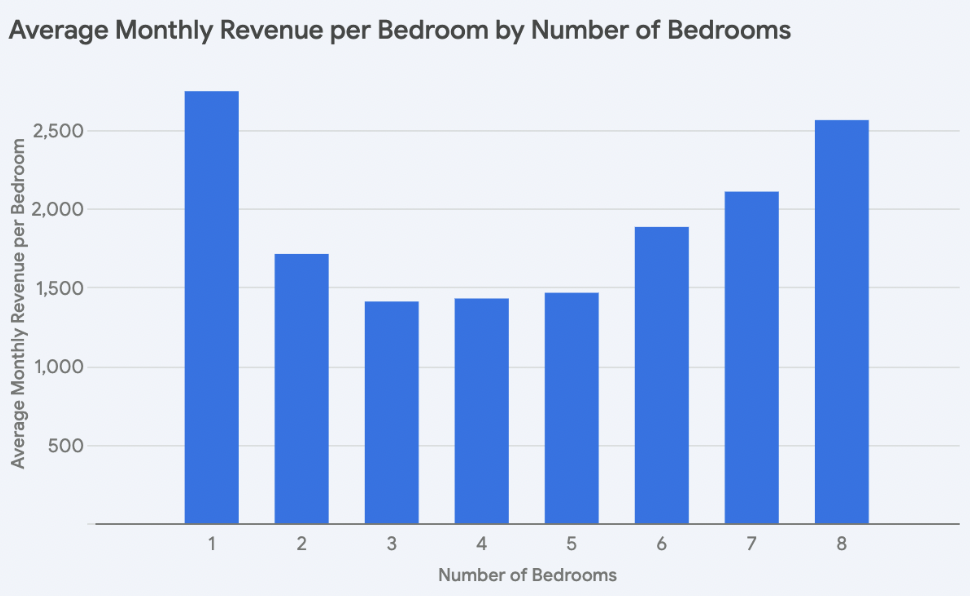
The average monthly revenue divided by the number of bedrooms of each asset displays an almost quadratic relationship with the number of bedrooms. Revenue per bedroom declines from 1-3 bedrooms, and increases from 3-8 bedrooms. This insight underscores the potential financial benefits of investing in larger properties within this market.
Amenity Analysis
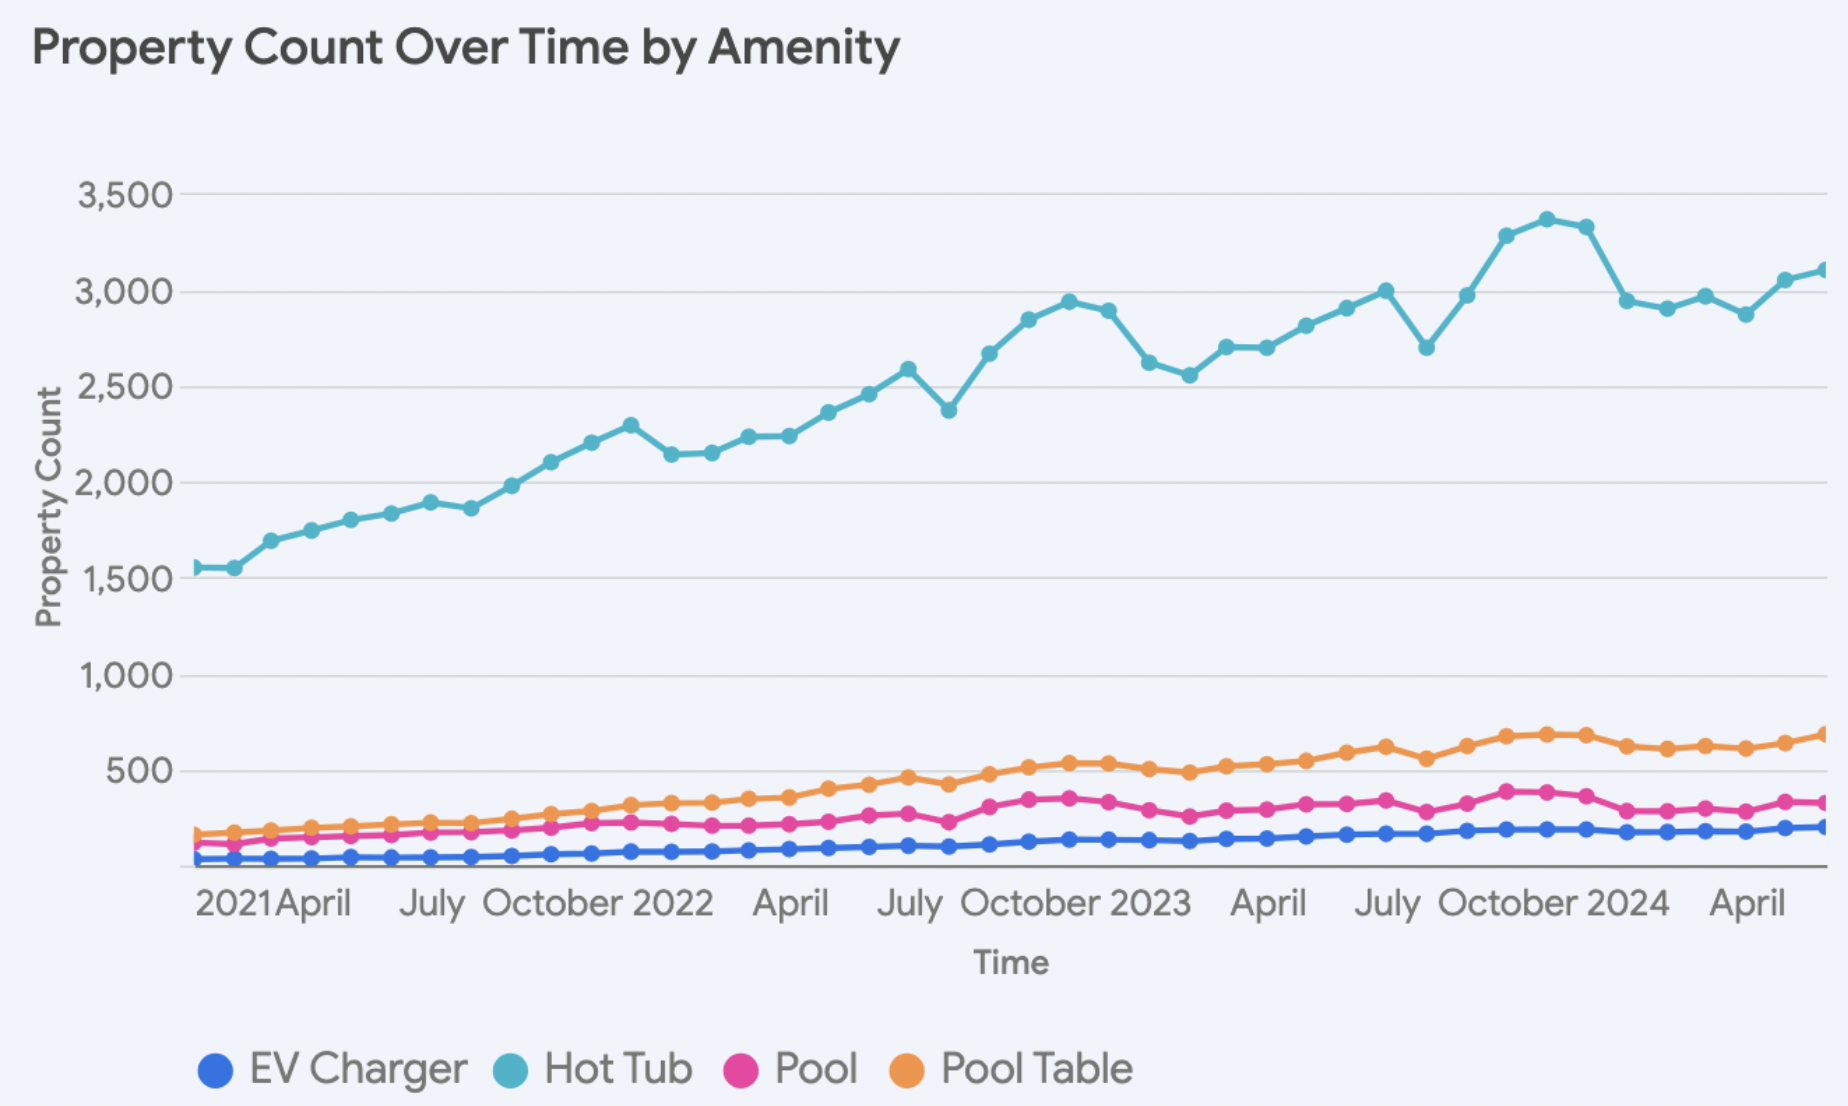
From 2021 to 2024, hot tubs have observed a significant 69% increase to 3,102 properties, while other amenities experienced even more dramatic growth. The demand for EV chargers skyrocketed with a remarkable 408% increase, reaching 198 properties, and pool tables also surged in popularity, demonstrating a 222% increase to 682 properties. In contrast, pools observed the smallest increase, growing by 53% to reach 324 properties.
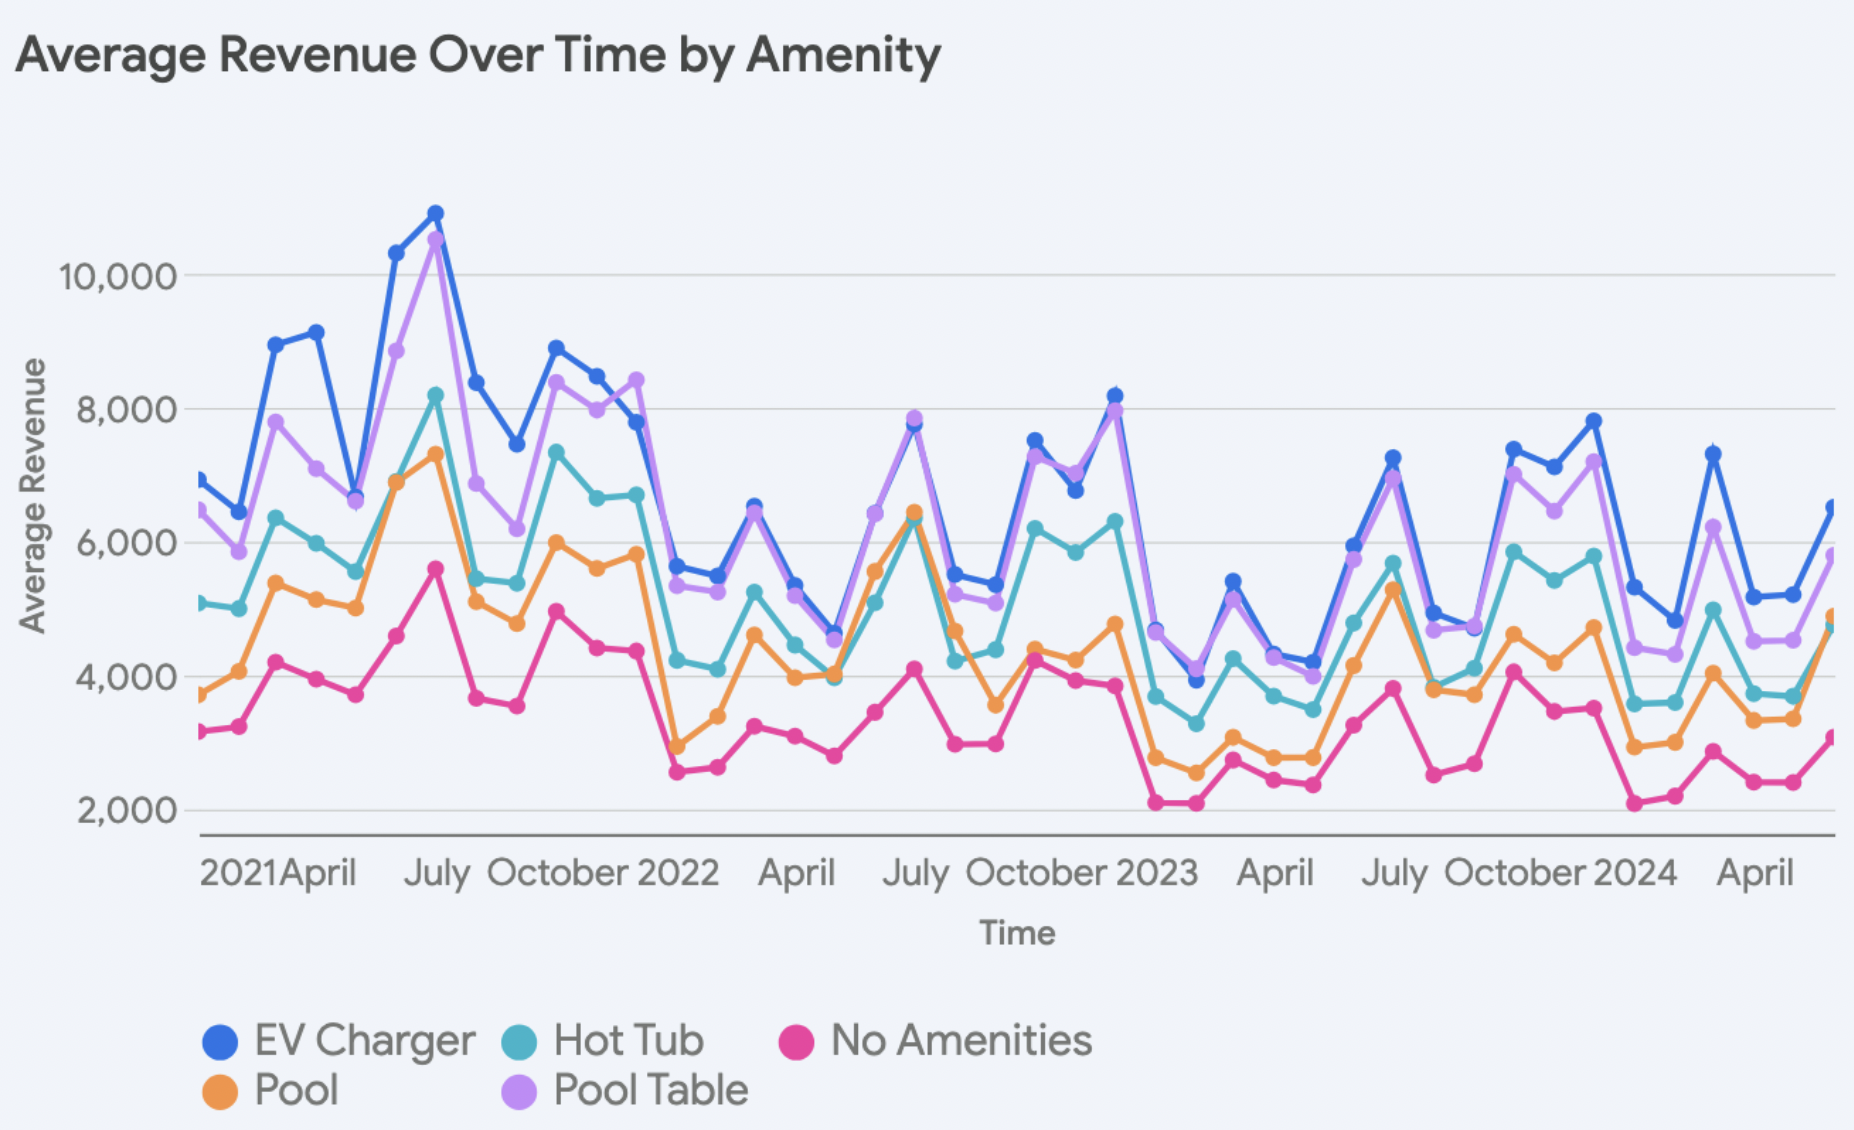
To assess the impact of amenities on revenue, a multivariate analysis was performed. This factored in the influence of investment-grade and bedroom count alongside individual amenities, providing a nuanced understanding of financial implications.
The analysis revealed some interesting results and all findings were statistically significant. Hot tubs were associated with an increase of $852 per month in revenue, while pools surprisingly showed a decrease of $301 per month. EV chargers were linked to an impressive $957 per month increase, and pool tables contributed a modest $113 per month increase.
Conclusion
The Blue Ridge STR market presents a complex and dynamic landscape for investors. The stabilization of investment-grade listings and the slowing growth of non-investment-grade properties suggest a maturing market. The revenue analysis further supports this claim, showing declines in average monthly revenue since 2021.
The growth in listings and the positive correlation between bedroom count and revenue highlight a significant demand for larger properties. Notably, large properties (6+ bedrooms) achieve outsized returns per bedroom compared to properties with 3 or 4 bedrooms. Such observations highlight an important dynamic in the market where investors should focus on obtaining as large of a property as possible to maximize performance.
The amenity analysis adds another layer of consideration, revealing the substantial impact certain amenities can have on revenue generation. The significant increases in the prevalence of hot tubs, EV chargers, and pool tables, coupled with their positive association with revenue, emphasize the importance of amenities in today’s STR environment.
While the Blue Ridge STR market can offer lucrative opportunities, success hinges on strategic property selection and a focus on providing valuable amenities.
To analyze properties with best-in-class underwriting AI and comp analysis, check out Revedy’s Underwriting Platform for investors.
INTERESTED IN BLUE RIDGE
Report by Michael Dreger
For more information email inquiry@revedy.com