
Ocean City, located about 2.5 hours from Washington, D.C., Baltimore, and Philadelphia, is a popular coastal destination with a thriving short-term rental (STR) market. This article will explore the latest trends in Ocean City’s STR market, including regulatory updates, revenue growth, and investment opportunities. It will also analyze seasonality, property types, and the impact of amenities on rental performance, offering insights for investors looking to maximize returns.
Regulations are currently very loose as STRs are allowed in every zoning district with a license from the city. To obtain a license, applicants must complete an inspection that evaluates the safety and condition of the rental unit and ensures compliance with occupancy limits.
However, over the past 6 months, Ocean City has been considering additional regulations for single-family R1 zoning districts and some mobile home (MH) districts like Montego Bay, which currently has a large number of mobile homes. Other areas potentially affected include the R1 neighborhoods of Cainewoods and Sallberry. One of the primary regulatory changes being discussed is the introduction of a minimum night stay requirement. The proposed range is likely 3 to 5 nights, with stays longer than seven days being unlikely.
Another possible change is in the way occupancy limits are calculated for single-family homes. Currently, occupancy is based on the size and number of bedrooms, as well as the size of living and dining areas. The city is considering a simplified model that would allow for 2 occupants per bedroom, plus an additional 2 people, with children excluded from the occupancy count. This adjustment aims to address the issue of larger bedrooms leading to disproportionately high occupancy limits.
Analysis
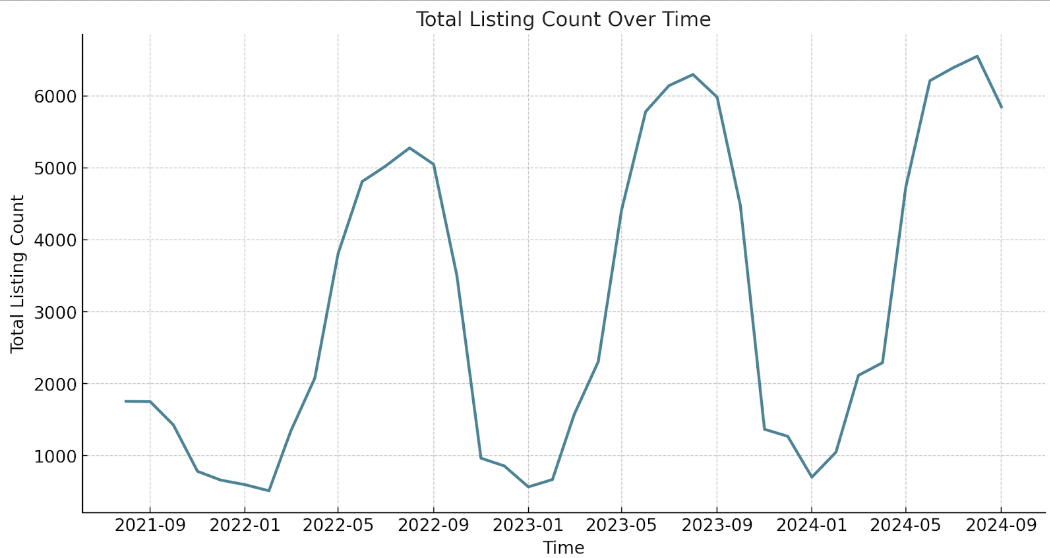
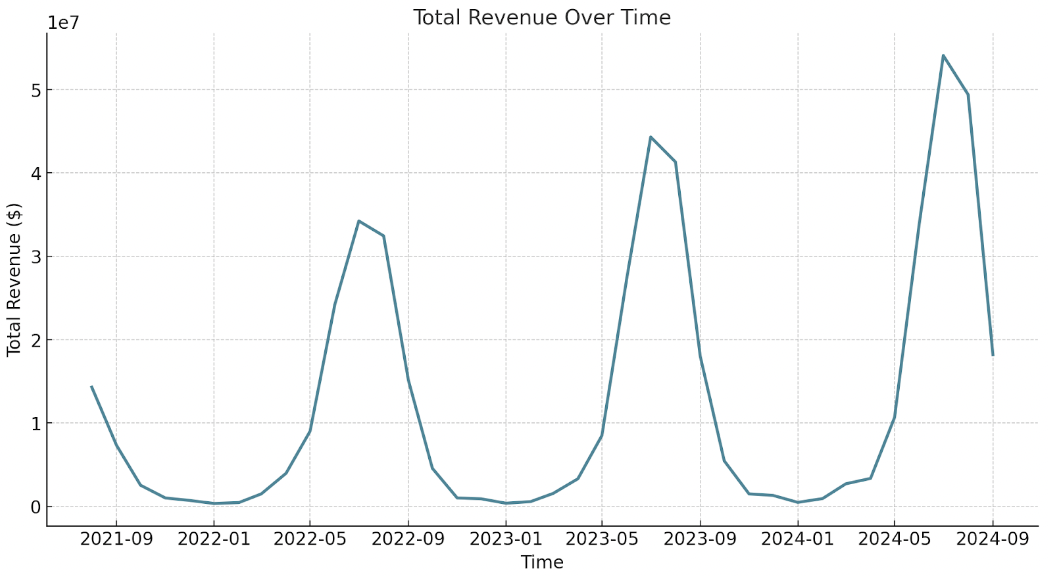
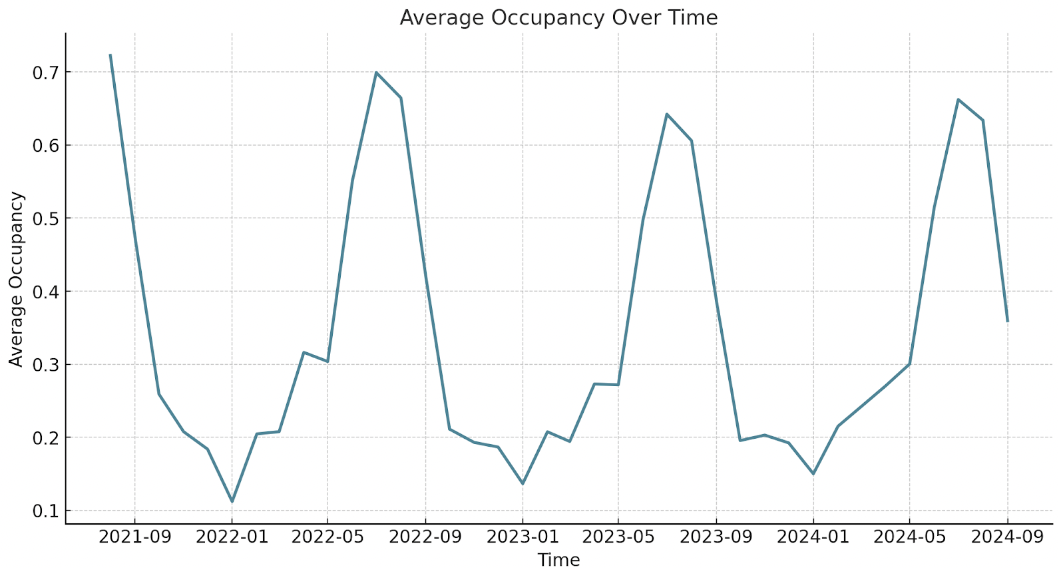
Ocean City’s STR market is characterized by pronounced seasonality, with peak demand during the summer. With high mortgage rates the past year, investment activity seems to have declined. Listings grew by 22% from 2022 to 2023, compared to just a 4% rise in 2024. However, demand has continued to grow, positioning the market as an appealing investment opportunity. Year-over-year, total revenue rose by 29% from July 2022 to July 2023, and by an additional 22% in 2024.
Growth in the off-season has also been relevant. Total revenue in February saw a year-over-year increase of 25.5% from 2022 to 2023 and a significant 61.6% from 2023 to 2024. Similarly, the number of listings grew by 30.4% from 2022 to 2023 and surged by 56.8% the following year.
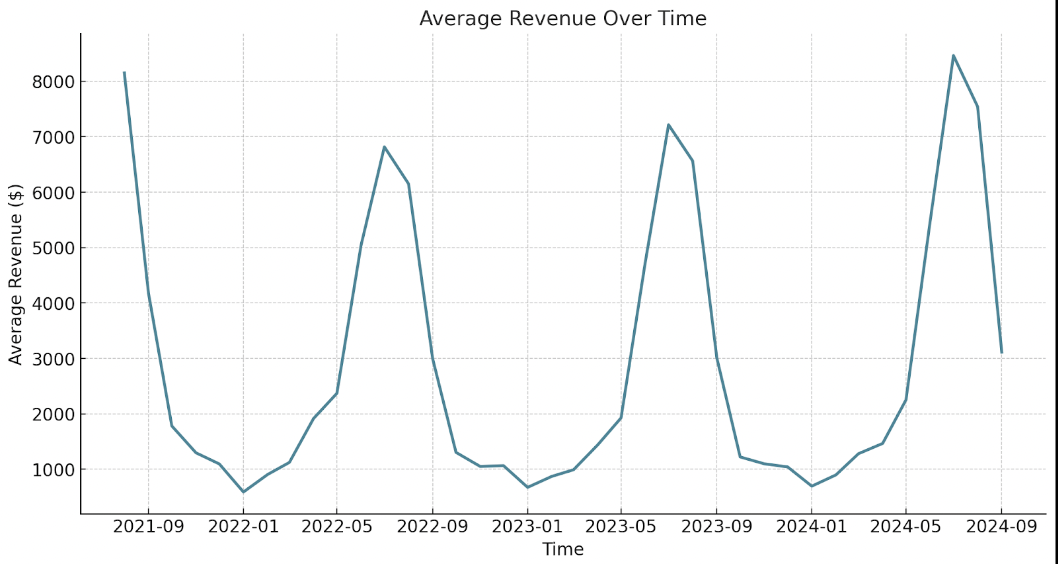
These revenue and supply trends have direct implications for investor returns. From 2022 to 2023, peak season returns grew by 6%, and this accelerated to 17% growth in 2024. Off-season returns, which dipped by 4% from 2022 to 2023, rebounded with a 3% increase in 2024.
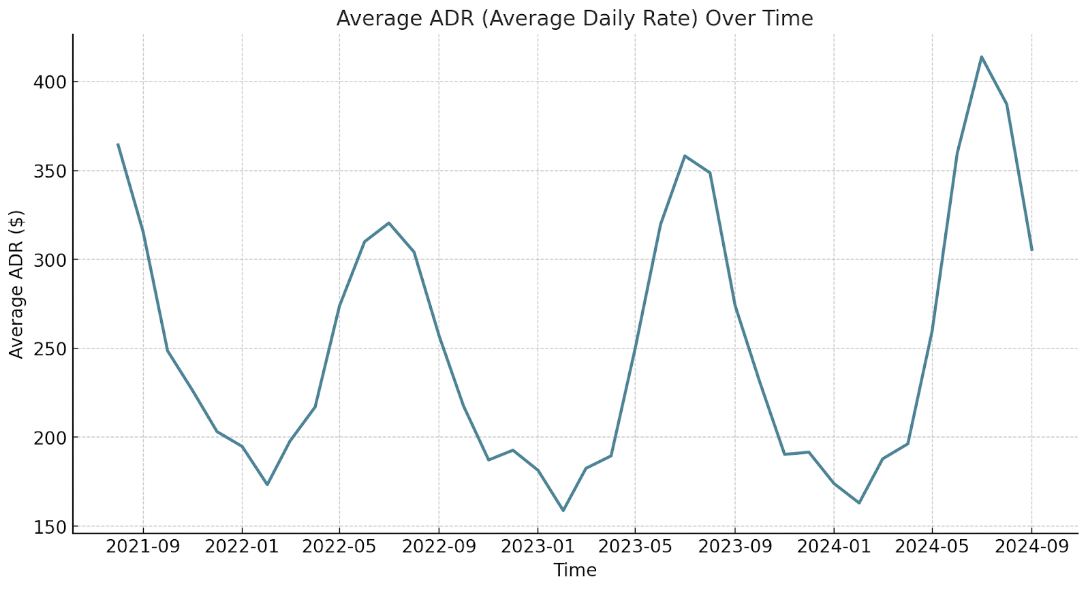
This rise in returns has been largely driven by growth in average daily rates (ADR). In June 2023, ADR increased by 12% despite an 8% drop in occupancy. By 2024, both ADR and occupancy were on the rise, with ADR up by 16% and occupancy improving by 3%.
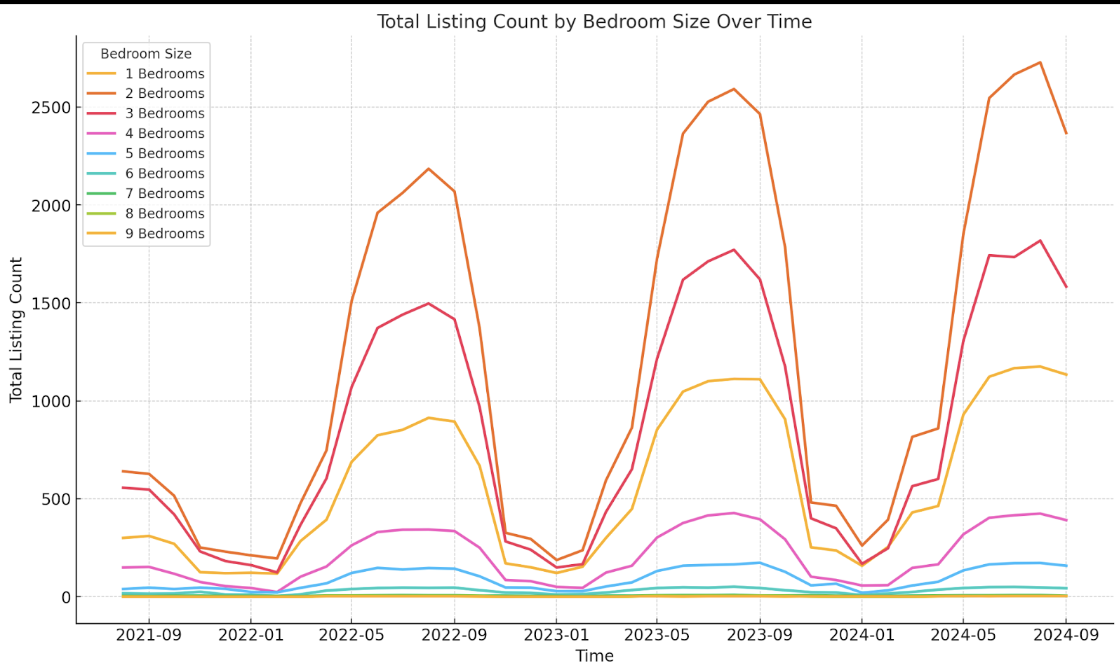
Analysis by property type reveals that apartments and condos make up 74% of the total listings. Additionally, 2-bedroom listings are the most common, followed by 3-bedroom and 1-bedroom rentals. In July 2024, 1-, 2-, and 3-bedroom units accounted for 18%, 42%, and 27% of the market, respectively.
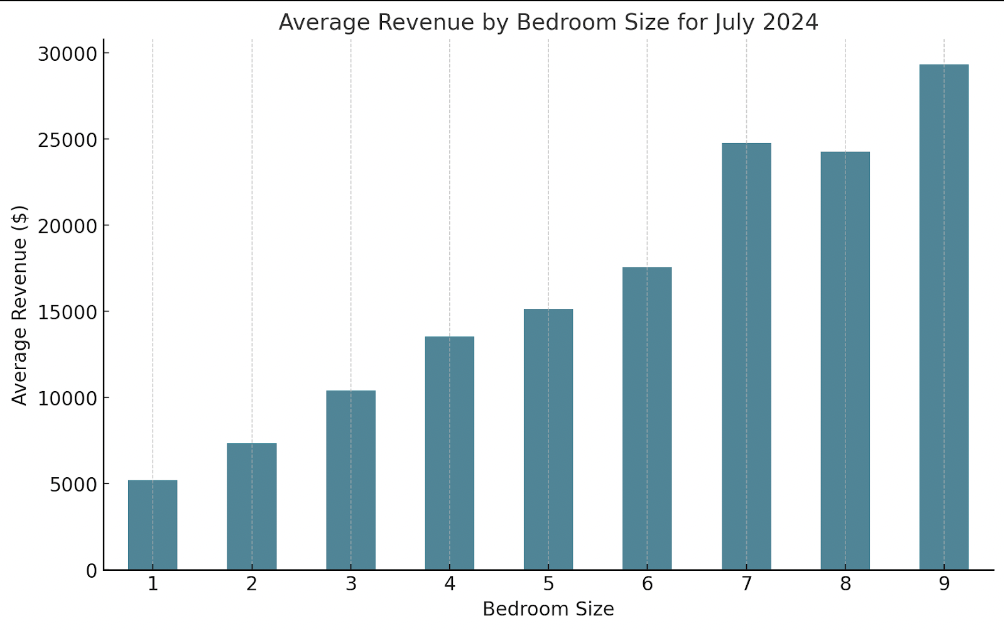
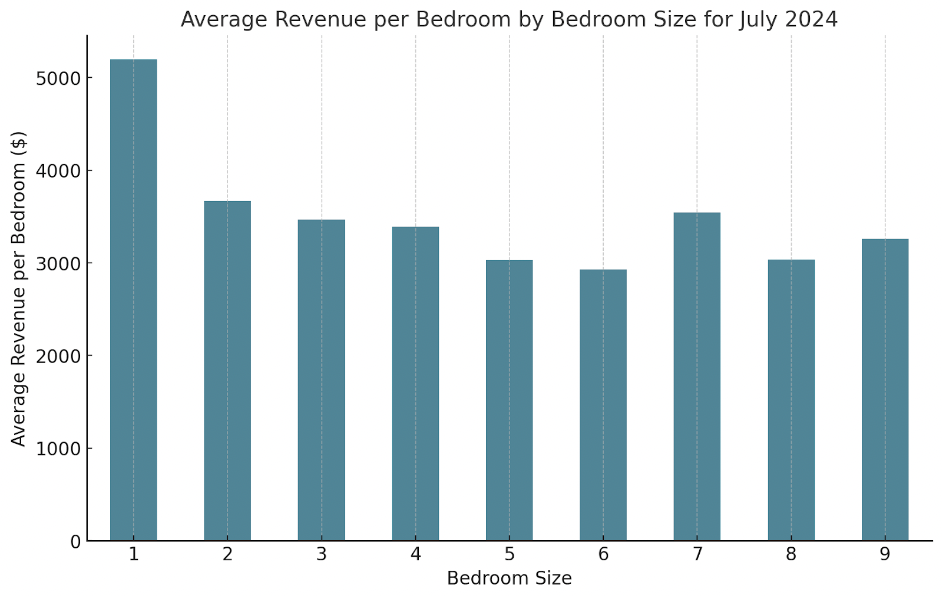
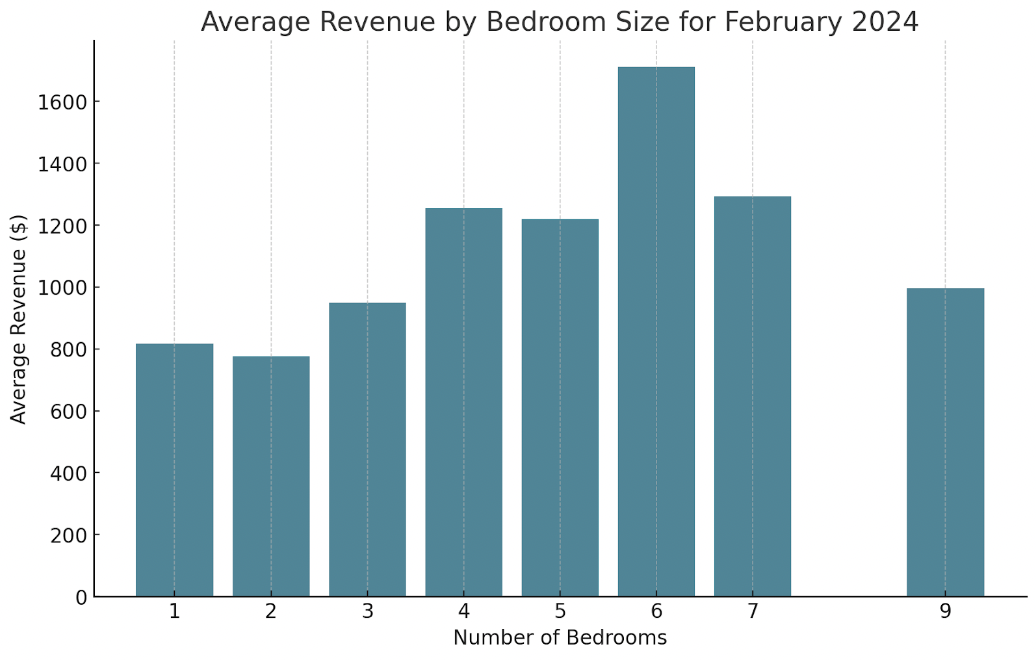
Additionally, during peak season, revenue tends to increase with the number of bedrooms, with each additional bedroom adding approximately $2,522. However, returns diminish with each extra bedroom beyond 2, except for 7-bedroom properties, which perform similarly to 2-bedroom rentals on a per-bedroom basis. A related pattern is also observed in other coastal markets, such as the Alabama Gulf Shores and Florida’s Emerald Coast.
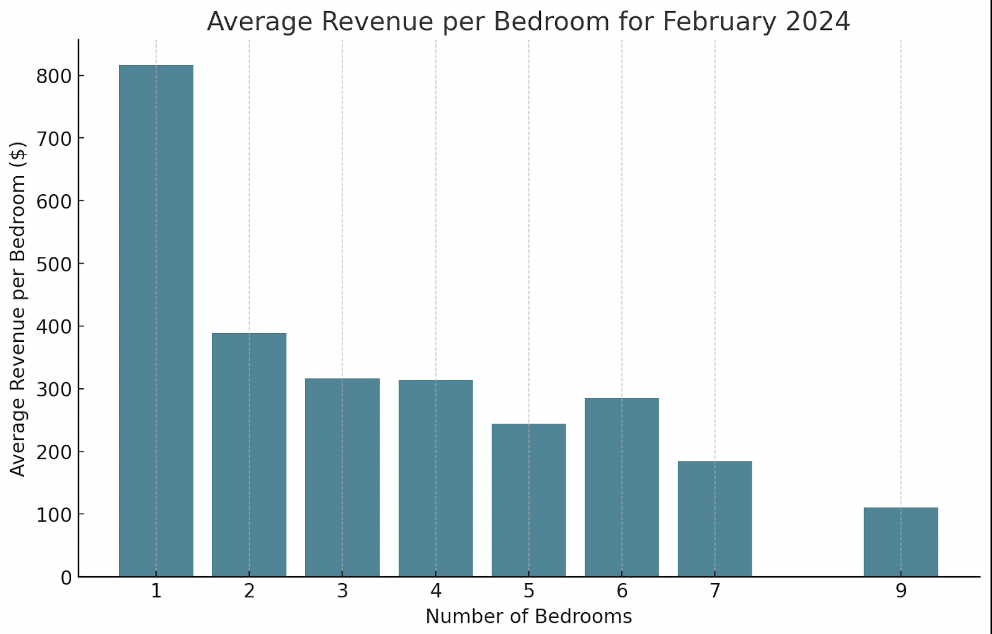
In the off season of February, the dynamics shift noticeably, with larger properties losing appeal. The revenue gain per additional bedroom drops to only $159, and as bedroom count rises, there is no increase in average revenue per bedroom.
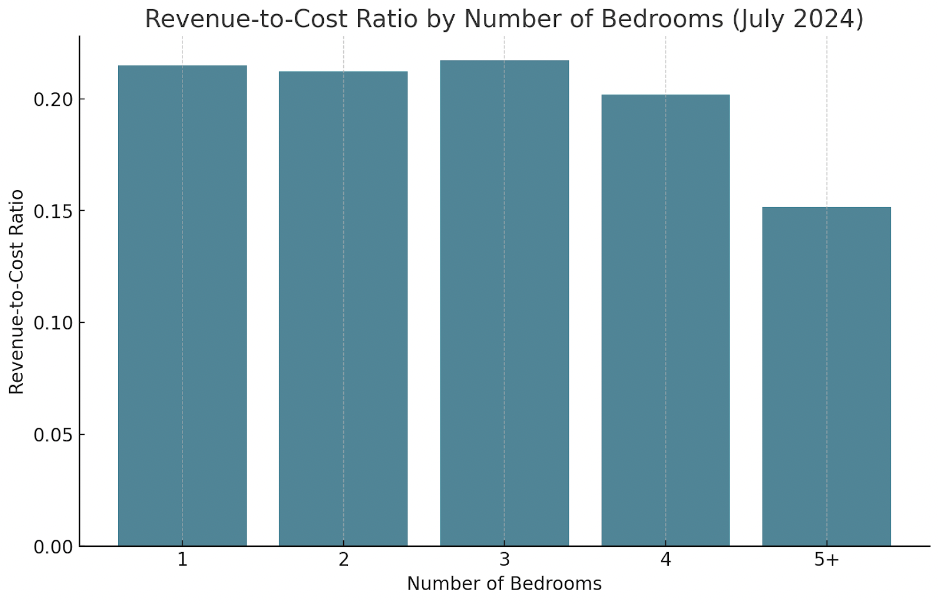
According to data from Rocket Homes, the cost per bedroom declines as the number of bedrooms on a property increases. When comparing this with annualized performance data from July 2024, the highest revenue-to-cost ratio is found for 3-bedroom properties, at 0.217. However, this ratio is only marginally higher than that of 1-bedroom and 2-bedroom properties, which have values of 0.215 and 0.212, respectively.
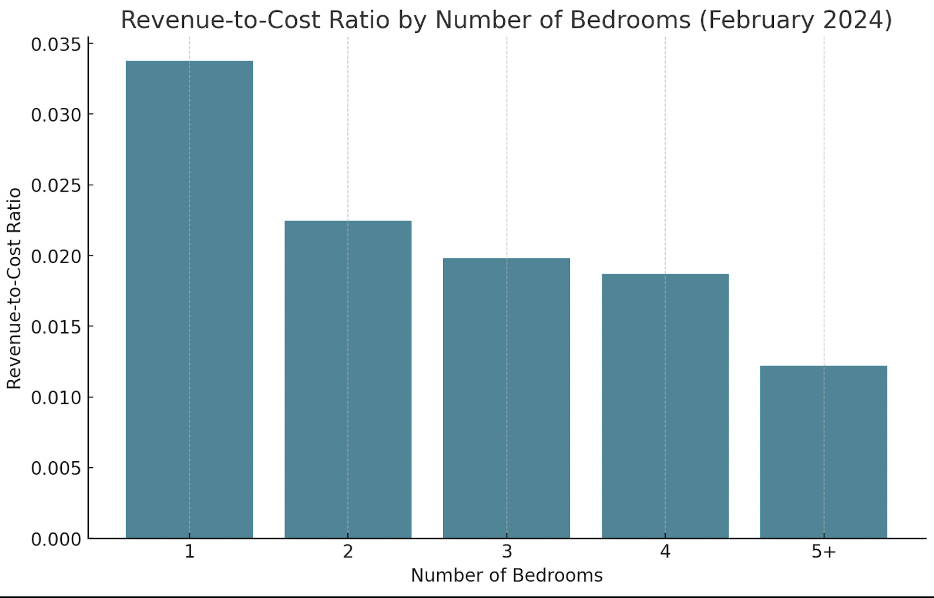
Again in February, this pattern changes significantly, with 1-bedroom properties emerging as the clear leaders in revenue-to-cost value, with a ratio of 0.034. This drops substantially for 2-bedroom properties, falling to 0.022, and continues to decline as bedroom count increases. Such analysis suggests that 1-bedroom properties offer the best investment opportunities in Ocean City.
Listings with pools and waterfront were the most prevalent amenities in the market, with 56% and 48% of listings featuring these amenities as of September 2024, respectively. Golf amenities are the third most common, followed by basketball courts, pool tables, electric vehicle (EV) chargers, and hot tubs.
A multivariate analysis of asset performance in peak season (July 2024) accounting for the impact of various amenities and bedrooms revealed the following effects on monthly revenue:
- Pool tables: +$1,711
- Pools: +$696
- Golf: +$1,730
- Waterfront: +$926
- Other amenities, like EV chargers, hot tubs, and basketball courts, did not show a significant impact.
With 74% of STRs in the market consisting of condos and apartments, investors should prioritize buildings that already include these popular amenities to maximize appeal. Additionally, focusing on rentals with 1-3 bedrooms is likely to yield the highest return on investment, as larger properties tend to see diminishing revenue gains.
Additionally, the proposed regulatory changes would impact single-family homes, making condos and other multi-unit properties more attractive.
Conclusion
With consistent year-over-year demand growth, Ocean City presents a prime investment opportunity. Investor returns have been growing substantially, particularly due to consistent rising demand and the recent slowdown in new investments in this market. While a future slowdown in returns is possible, historical trends suggest that the market is poised for substantial revenue growth in 2025.
Want to see high-performing STRs in Ocean City?
Reach out and we’ll find the right investment for you.
Report by Michael Dreger
For more information email inquiry@revedy.com
Raw Data provided by KeyData