
The Fargo Short-Term Rental (STR) market is shaped by three interconnected cities: West Fargo, ND, Fargo, ND, and Moorhead, MN. While these cities are part of the same metro area and share similar market trends, they each operate under distinct regulatory environments.
West Fargo, ND, currently has no formal regulations on STRs, however city officials are discussing what regulations might be necessary. As part of this, they are considering the metro flood diversion project, which is set to be completed by 2030 and is expected to boost property values and spur new development opportunities.
In Fargo, ND, STRs are prohibited in residential zones and only allowed in light industrial areas. In contrast, Moorhead, MN, permits STRs in any area where regular rentals are allowed, including residential zones. However, owners must undergo an inspection and pay a yearly $150 permit fee for single-family homes.
The following analysis dives deeper into key factors like revenue trends, market saturation, and the impact of amenities in the Fargo STR market. Combined with the regulatory landscape, these elements provide a comprehensive overview of the opportunities and challenges within this evolving market.
Analysis
There has been consistent growth in individual asset performance, signaling a robust STR market. Peak-season investor returns in July increased by 13% in 2023 and 10% in 2024. Although off-season returns in January 2023 dropped by 11% compared to 2022, a notable 27% increase was observed in 2024. In an environment where many destinations are seeing shrinking returns, this exceptional growth is particularly impressive.
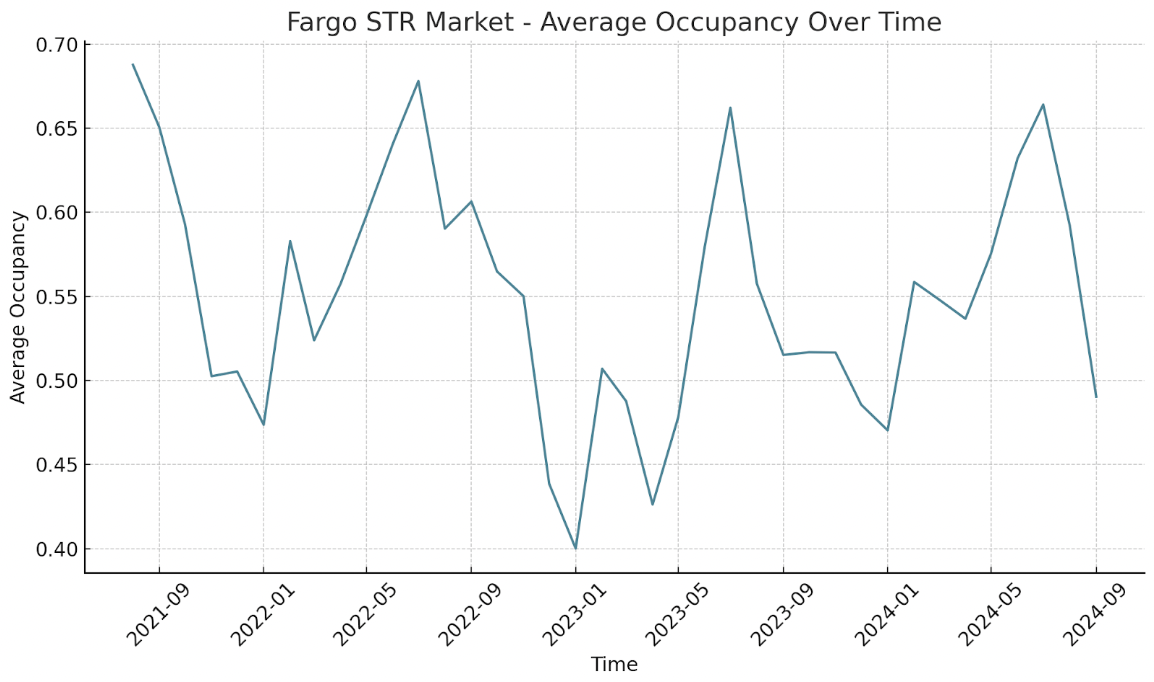
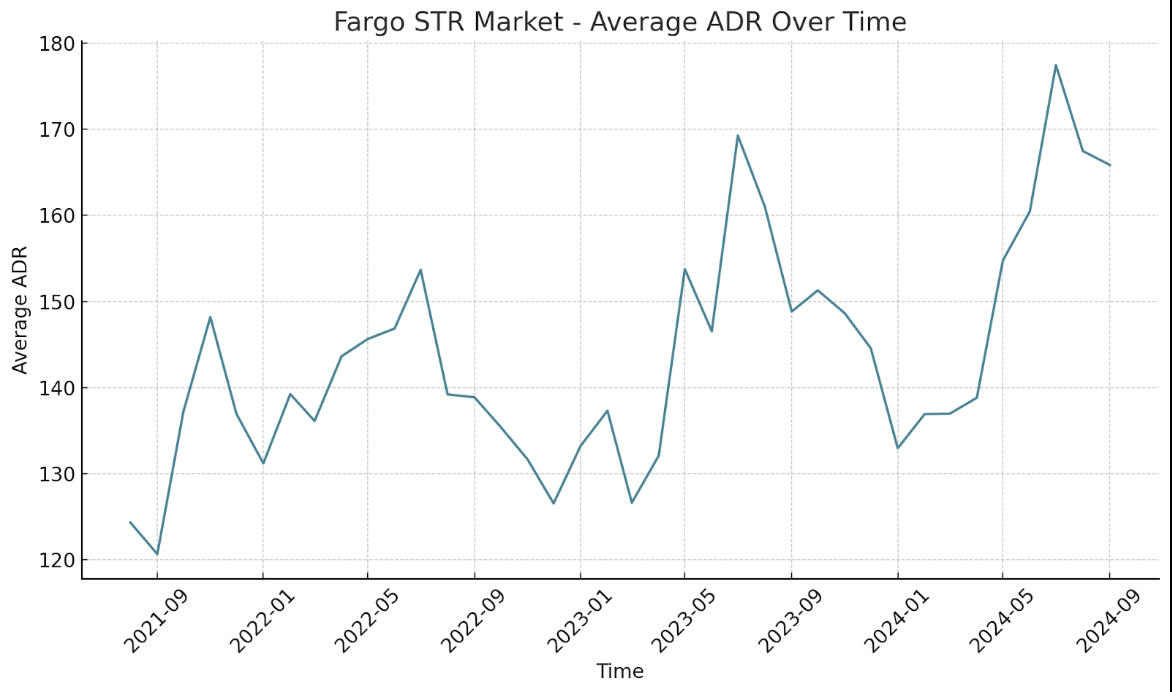
This strong asset performance is driven by rising average daily rates (ADRs) across the region. In July, ADRs increased by 10% in 2023 and 5% in 2024. However, this was coupled with a 2% decline in occupancy in 2023, followed by a slight 0.3% increase in 2024.

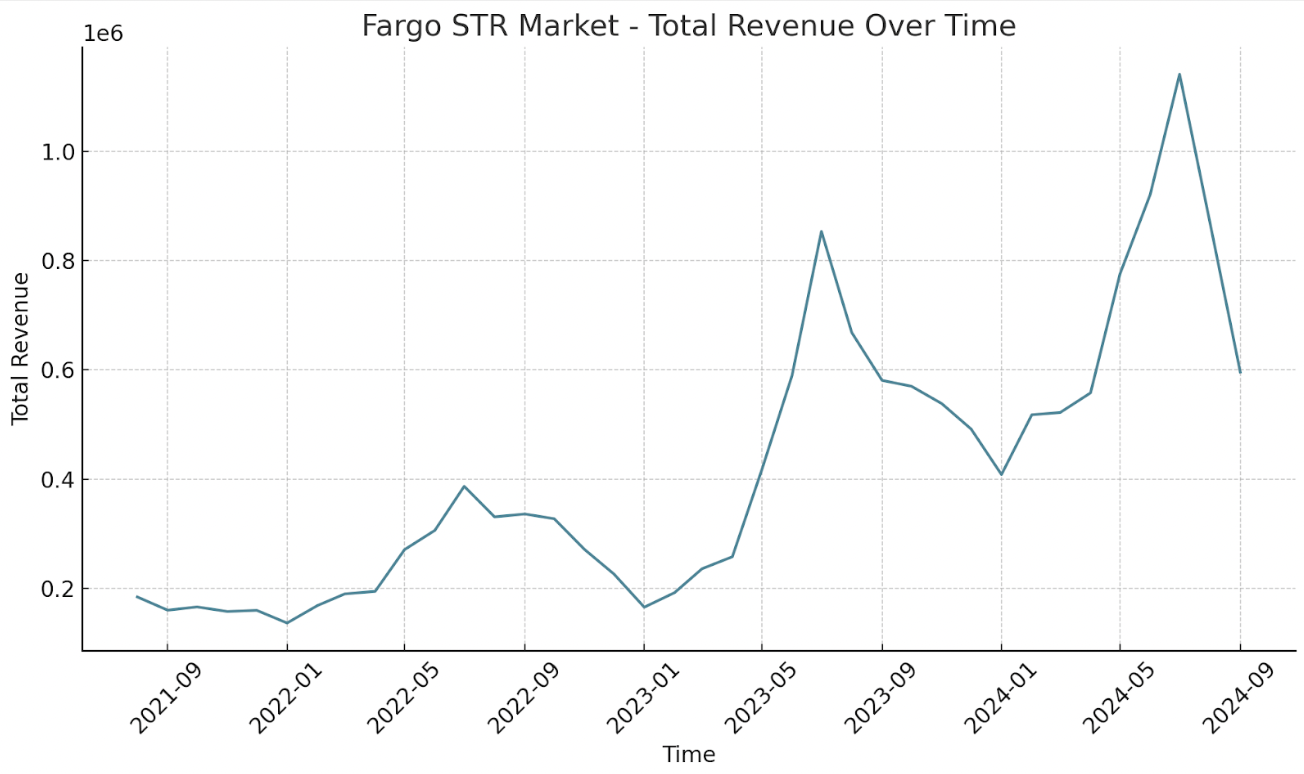
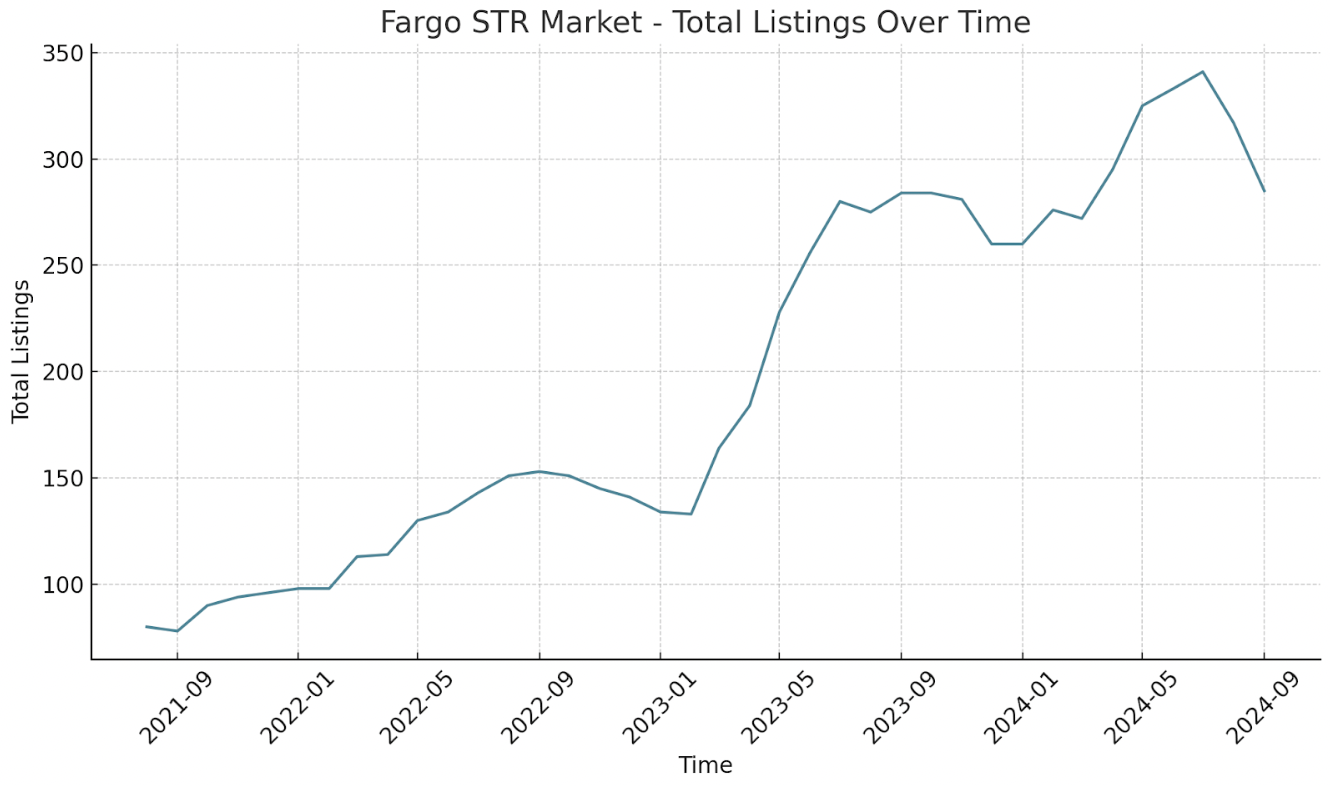
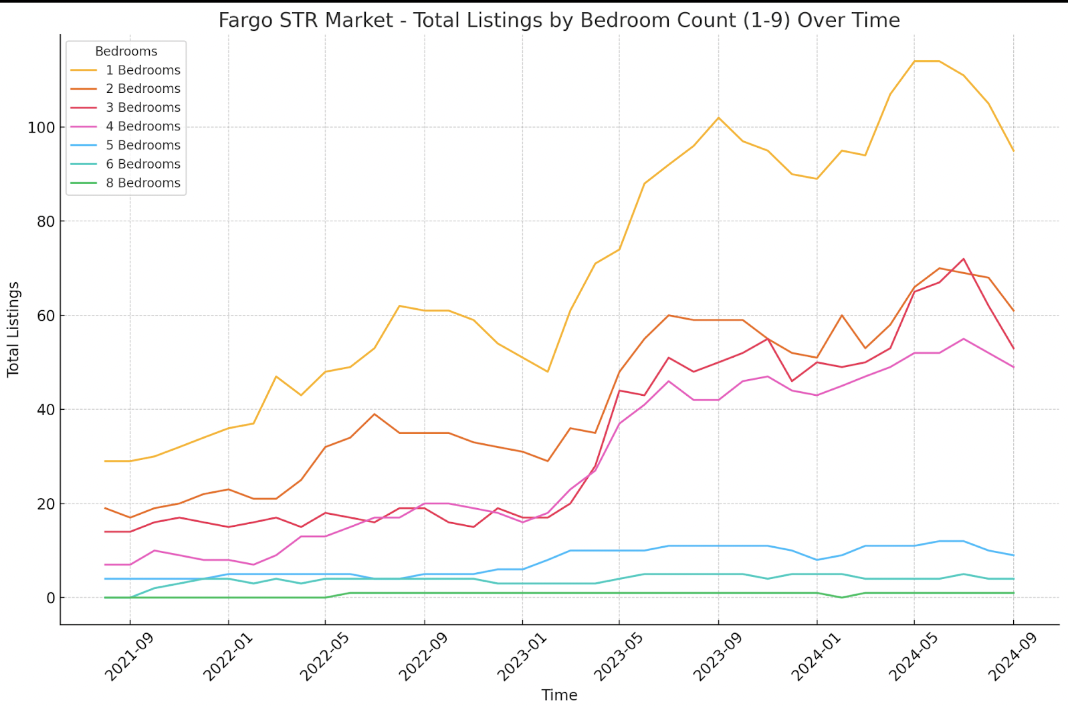
Total revenue in Fargo has been growing at a jaw-dropping pace. From July 2022 to July 2023, total revenue surged by 121%, with a further increase from 2023 to 2024 of 34%. In 2023, the rise in returns coincided with a substantial increase in listings. Between July 2022 and July 2023, total listings grew by 96%. This growth slowed somewhat in 2024, with listings increasing by 22%.
Overall, these results suggest that demand for the region is outpacing supply and is likely to continue in the next 1 to 2 years.
Regarding accommodation sizes, 1-bedroom properties had the highest saturation in September 2024, comprising 33% of the market. This was followed by 2-, 3-, and 4-bedroom properties with saturation levels of 21%, 19%, and 17%, respectively.
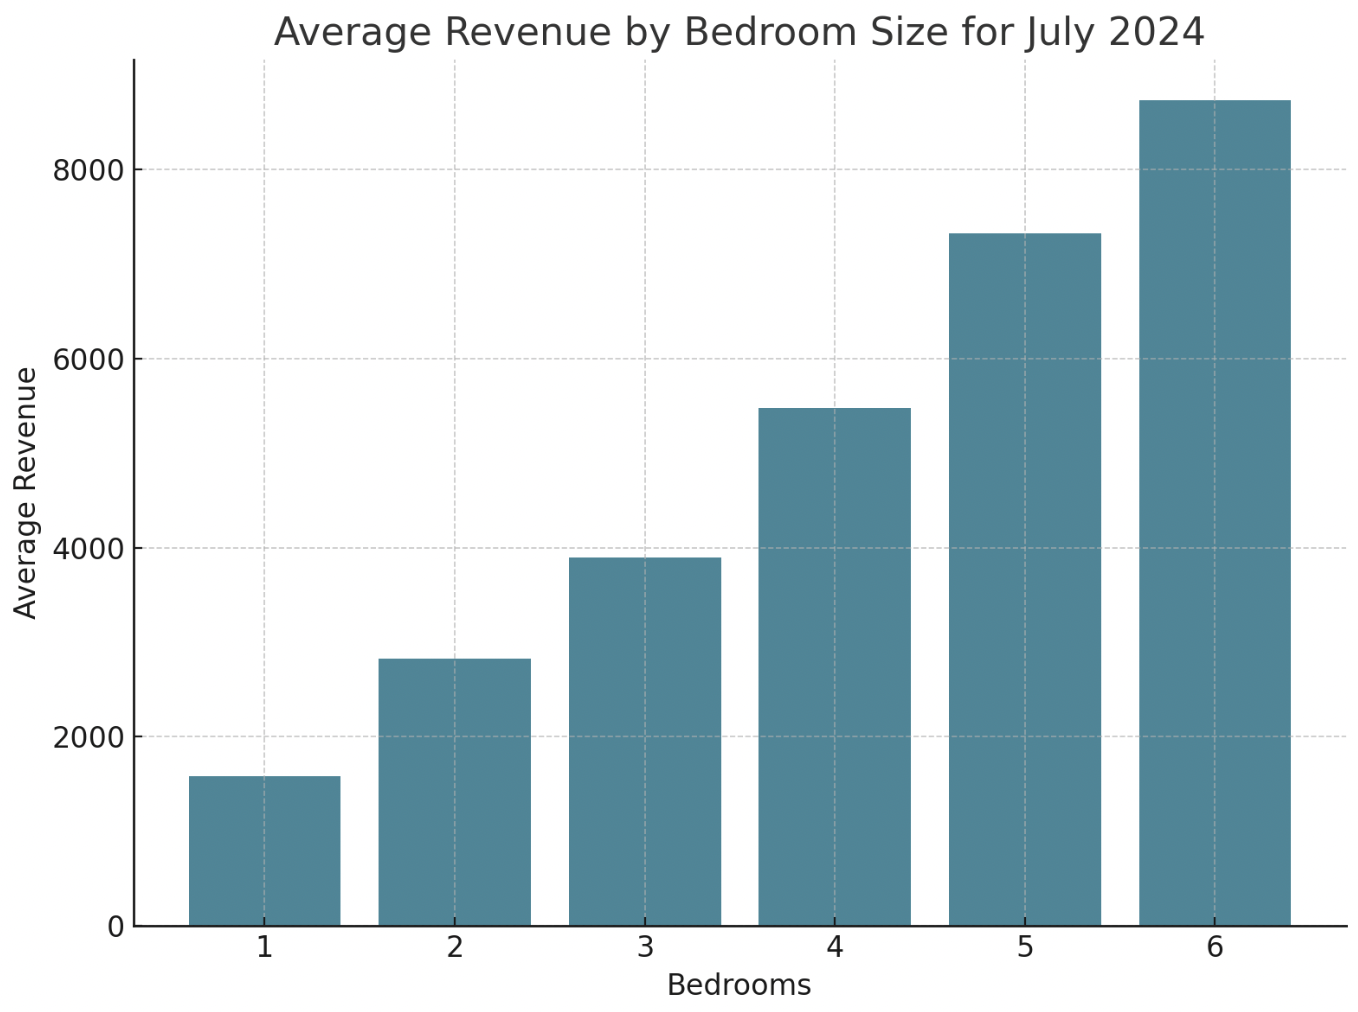
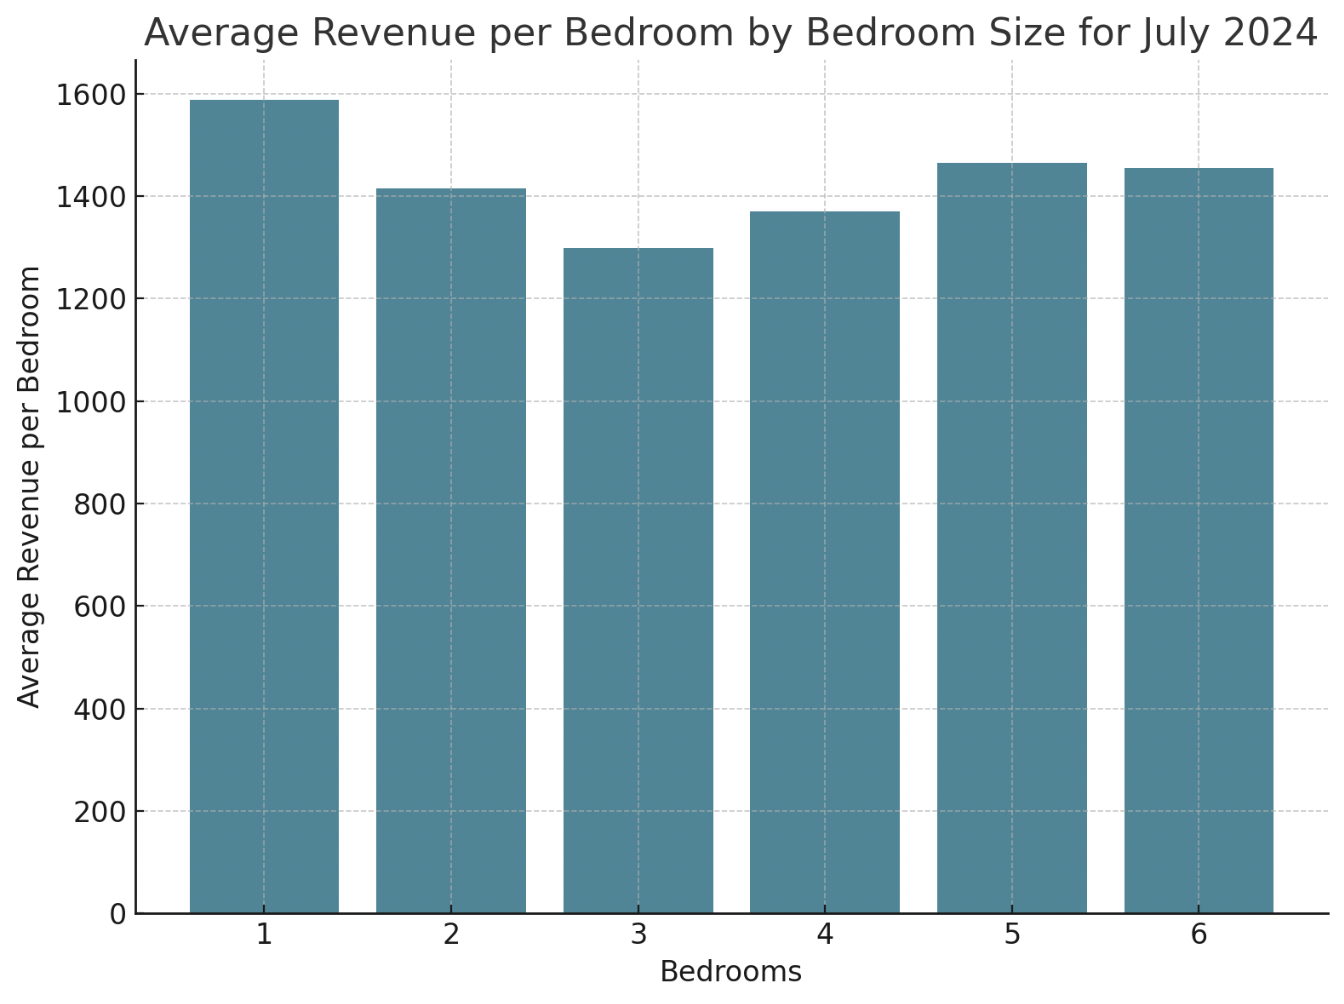
Each additional bedroom increased average revenue by an average $1,428 in July 2024. However, there is a noticeable decrease in the revenue per bedroom for listings with 1- to 3-bedrooms. This trend reverses for 4-bedroom listings, where revenue per bedroom ($1,370) exceeds that of 3-bedroom properties ($1,298). Overall revenue efficiency remains fairly consistent from 4- to 6-bedroom listings, with 5-bedroom properties having the highest efficiency at $1,464.
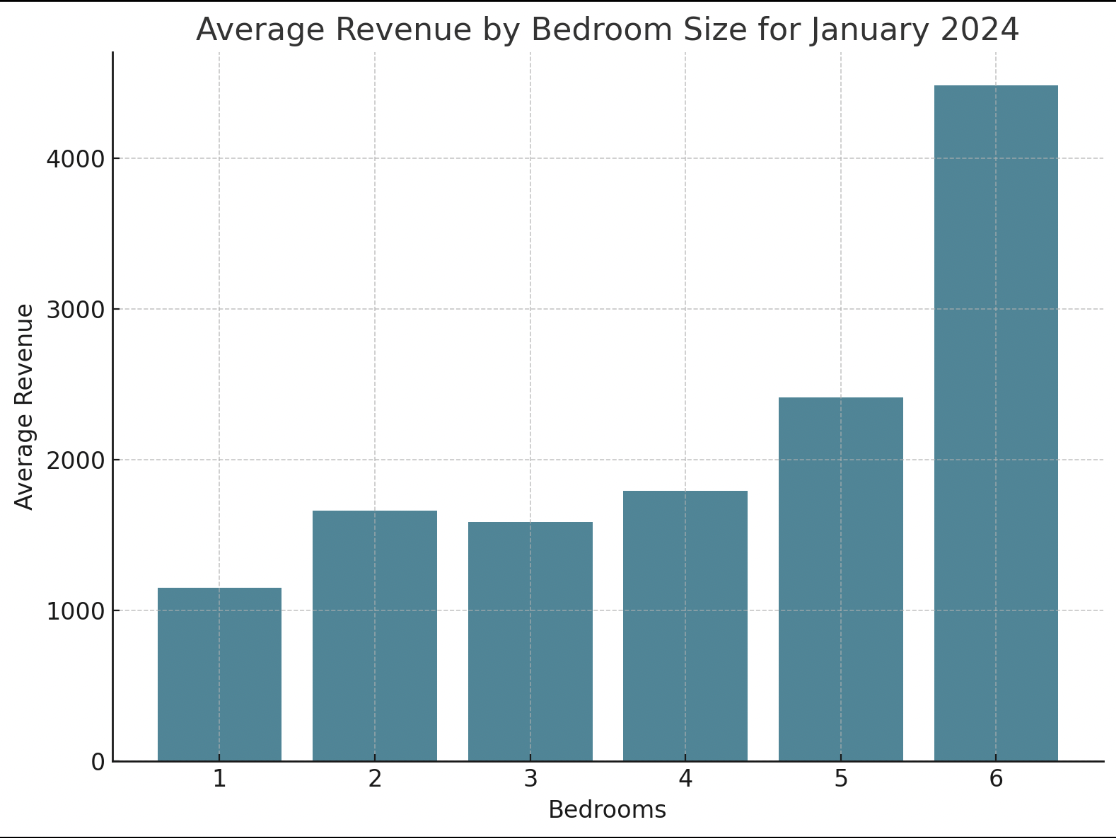
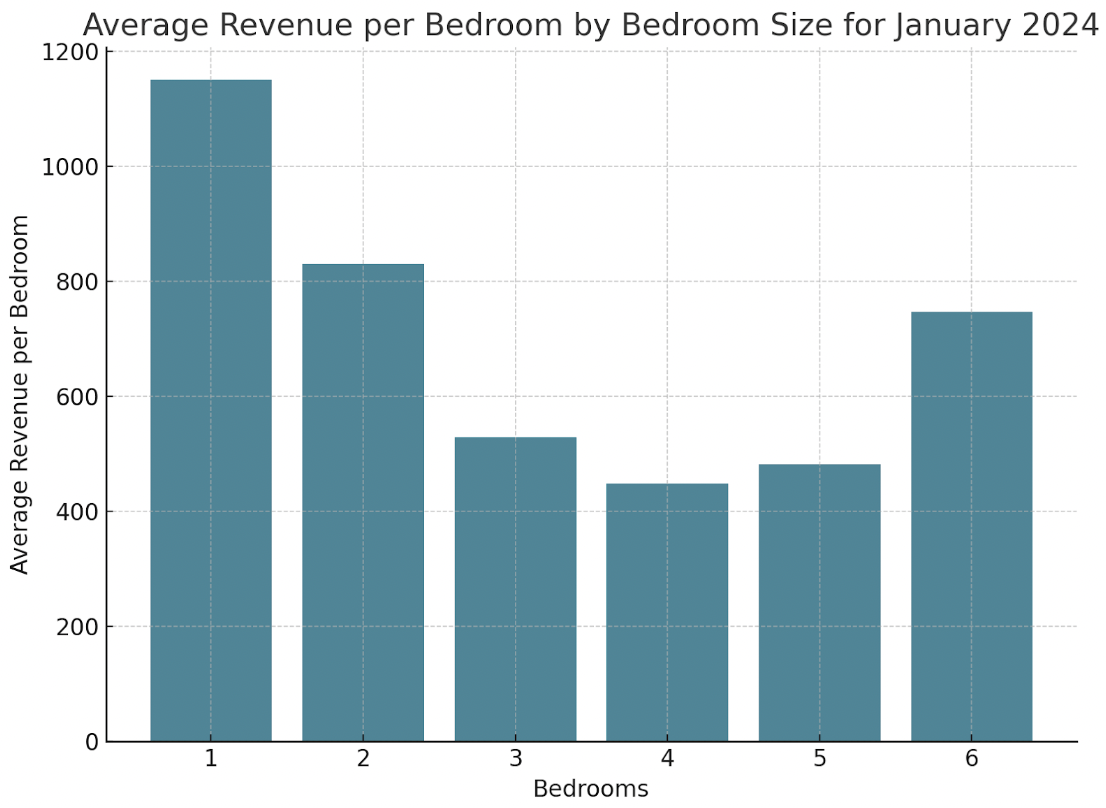
However, these trends change in the off-season. In January 2024, average revenue increases for 1- to 4-bedroom properties were much similar. There was a noticeable jump from 4- to 5-bedroom properties (+$617), and from 5- to 6-bedroom properties (+$2,070). This is reflected by the associated revenue per bedroom efficiency, as 4-bedroom properties recorded lowest in this metric in January 2024 at $449 per bedroom.
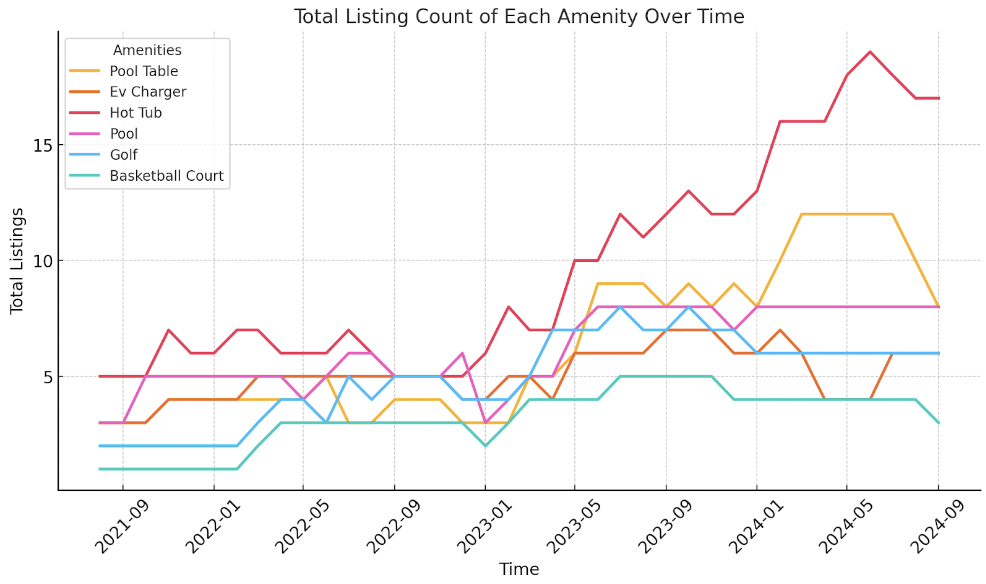
To assess the impact of amenities on performance during peak and off-season months, a multivariate analysis was conducted, accounting for the impact of bedrooms. However, due to a small sample size, the results should be interpreted with caution. Out of 285 properties listed in Fargo in September 2024, only 13% offered amenities. The chart ‘Average Revenue Over Time for Each Amenity’ provides further insight into the historical returns of these amenities, extending beyond the multivariate analysis below.
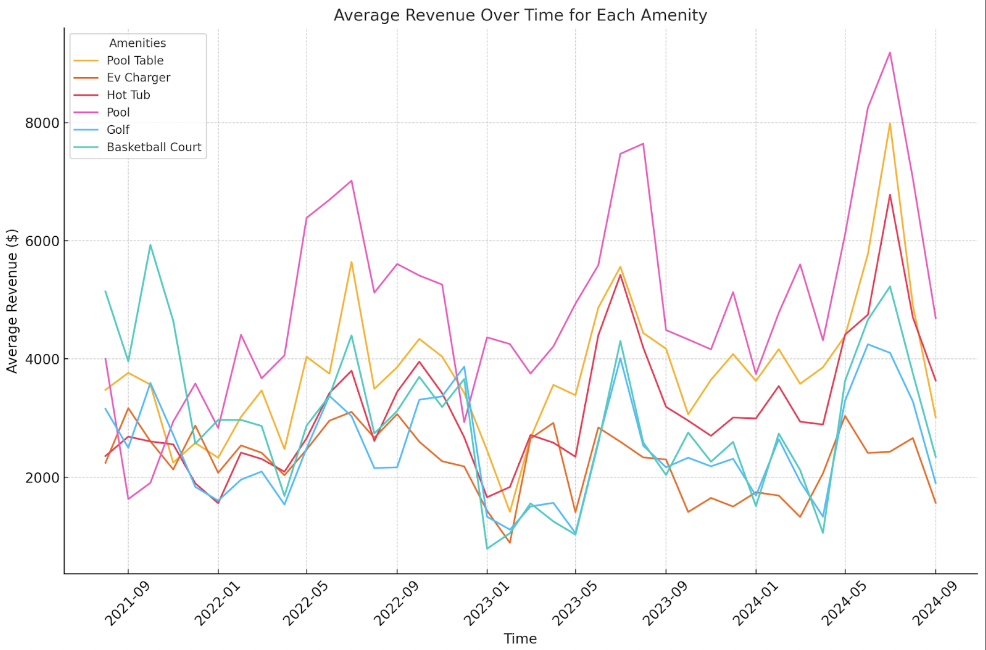
Impact of Amenities on Monthly Revenue (July 2024 – Peak Season):
- Pool Table: +$1,153
- EV Charger: Not statistically significant
- Hot Tub: +$807, marginally significant
- Pool: +$3,485
- Golf: Not statistically significant
- Basketball Court: +$3,368
Impact of Amenities on Monthly Revenue (January 2024 – Off-Season):
- Pool Table: +$1,123
- EV Charger: Not statistically significant
- Hot Tub: +$693, marginally significant
- Pool: +$1,513
- Golf: Not statistically significant
- Basketball Court: Not statistically significant
Based on these findings, adding pool tables and hot tubs seems like a clear choice for increasing year-round revenue. Furthermore, pools can significantly enhance the value of assets in this market
Although basketball courts typically cost less to install than pools (usually under $20,000), their return on investment is limited. While basketball courts boosted returns in July 2024 by a similar amount to pools, this impact is not consistent throughout the year. There is no statistically significant effect in the adjacent months of June or August, nor during the off-season in January. In contrast, pools consistently provide significant revenue increases throughout these months, including the rise noted in January, as well as a $3,985 boost in June and a $2,951 increase in August.
Conclusion
The Fargo STR market, driven by strong asset performance and impressive growth, presents a unique opportunity for investors. Despite the regulatory differences across Fargo, West Fargo, and Moorhead, the market’s potential is evident through rising average daily rates and growing revenue. The impact of amenities, such as pool tables and hot tubs, highlights strategic avenues for maximizing returns, especially during peak and off-season months. With the expected boost from infrastructure projects like the metro flood diversion, the Fargo STR market is well-positioned for sustained growth in the coming years.
Want to see high-performing STRs in North Dakota?
Reach out and we’ll find the right investment for you.
Report by Michael Dreger
For more information email inquiry@revedy.com
Raw Data provided by KeyData